Post-IPO Compensation Strategy: Aligning Executive Pay with Public Markets
Introduction
Recognizing the importance of an effective compensation plan for attracting, retaining, and motivating key executive talent during an initial public offering (IPO), Alvarez & Marsal Tax, LLC (A&M) released its Initial Public Offering Compensation Report (IPO Report) in 2021 and again in 2024. The 2024 IPO Report analyzed Form S-1 statements filed by companies that underwent IPOs between 2021 and 2023. While these IPO Reports provide valuable insights into the typical market practices for executive compensation during the lead up to the IPO, it is also valuable to understand compensation practices immediately after companies transition from private to public. To that end, A&M performed a similar review of recently public companies’ first proxy statements and compared its findings to the data in its 2024 IPO report.
Pre-IPO Companies
A&M analyzed the Form S-1 statements filed by 497 companies that went public between 2021 and 2023. The median market cap of the Pre-IPO companies was approximately $730 million at the time of their IPO. These companies operate across various sectors.
Post-IPO Company Statistics
A&M analyzed the first proxy filed by 650 companies that went public between 2017 and 2023. The median market cap of the Post-IPO companies was approximately $670 million at the time of their IPOs. These companies operate across various sectors.
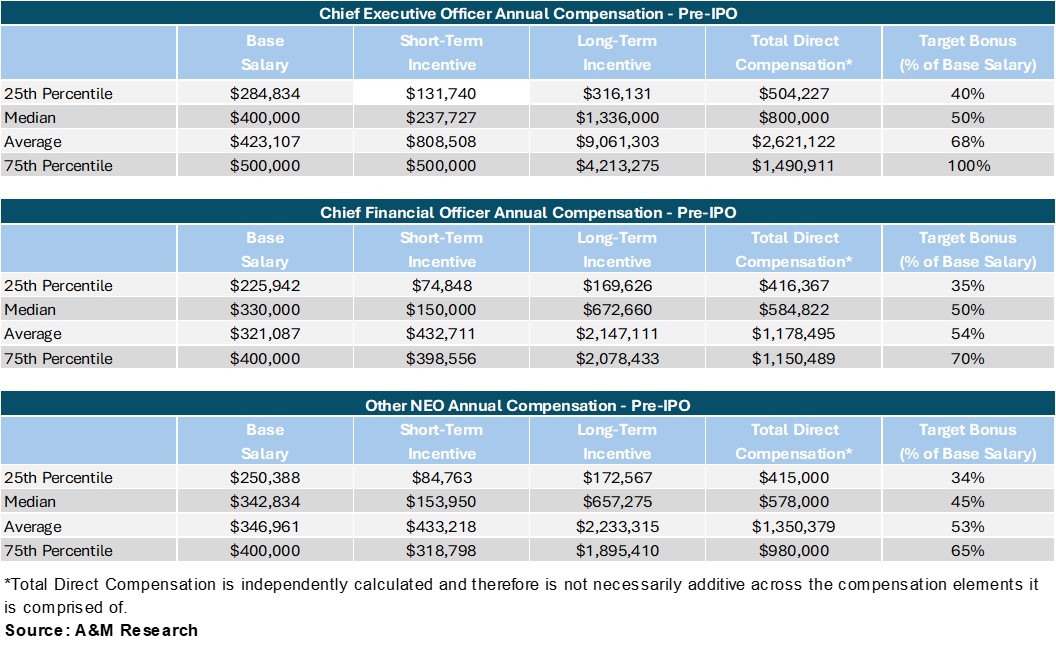
Pre-IPO Compensation
A&M captured Pre-IPO compensation data from the summary compensation table disclosed in Form S-1 for each company analyzed (as applicable for the year in which the company went public).
The following tables show each element of actual compensation broken out by percentile rank for Chief Executive Officer (CEO), Chief Financial Officer (CFO), and Named Executive Officers excluding CEOs and CFOs (herein referred to as NEOs).
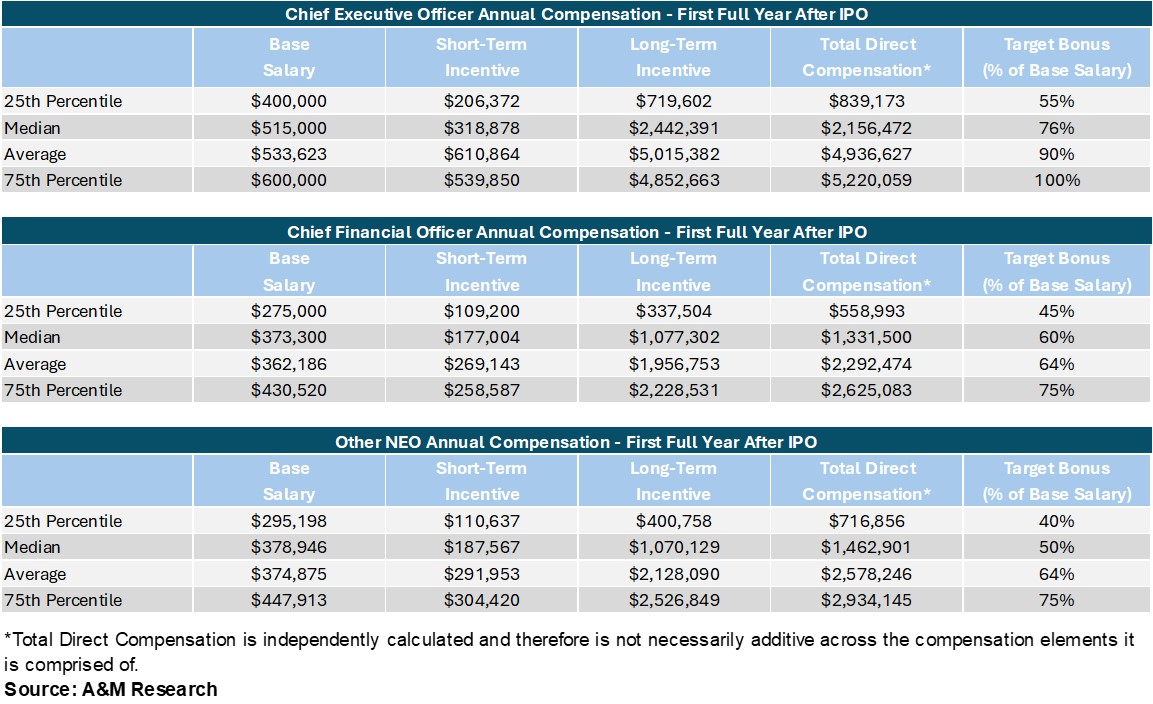
Post-IPO Compensation
We captured Post-IPO compensation data from the summary compensation table disclosed in the definitive proxy statement (Form DEF 14A) for each company analyzed (as applicable for the year after the company had its IPO).
Comparing Pre-IPO Compensation to Post-IPO Compensation
As supported by the data below, transitioning to public company executive compensation programs comes with a lot of change. Comparing the Pre-IPO data set to the Post-IPO data set suggests significant increases between Pre- and Post-IPO total direct compensation for each of the position groups that we examined.
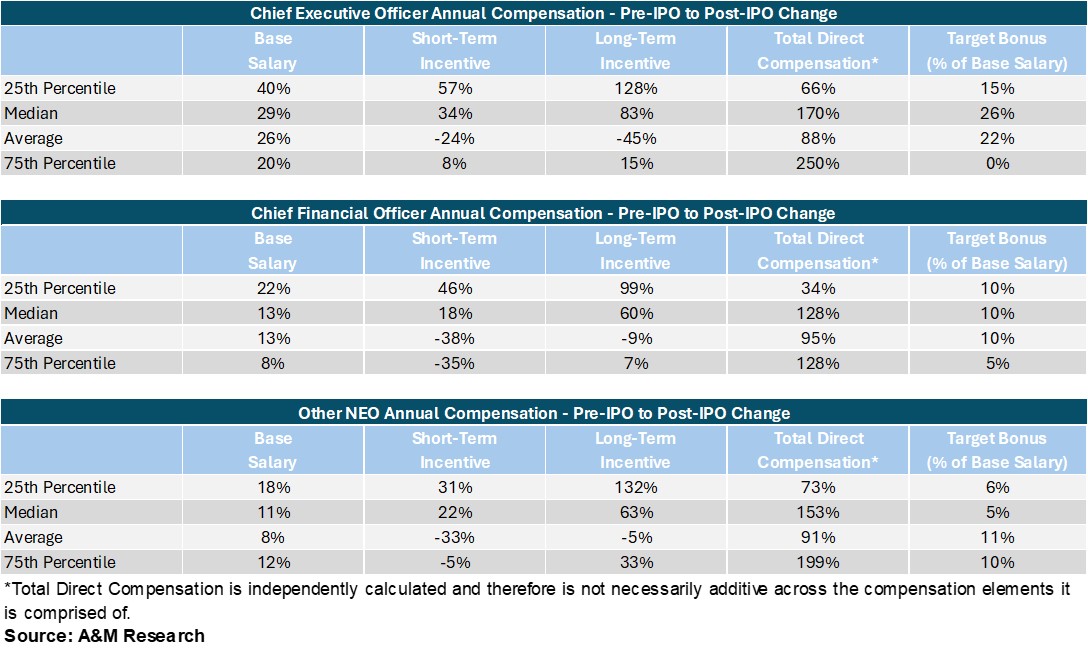
We note that average short-term incentives (STI) and long-term incentives (LTI) for all positions, driven by extreme outliers in the Pre-IPO data set that resulted in the average compensation data points that were higher than the 75th percentiles data points. The Post-IPO data had fewer such outliers resulting in lower averages, relative to the Pre-IPO data, despite an increase at the 25th, 50th, and 75th percentiles.
Key Takeaways
Total Direct Compensation
- The median Post-IPO CEO total direct compensation is approximately 170% higher than Pre-IPO levels, while the 25th percentile is approximately 66% higher, and the 75th percentile is approximately 250% higher. The average Post-IPO CEO total direct compensation is approximately 88% higher than Pre-IPO levels.
- The median Post-IPO CFO total direct compensation is approximately 128% higher than Pre-IPO levels, while the 25th percentile is approximately 34% higher, and the 75th percentile is approximately 128% higher. The average Post-IPO CFO total direct compensation is approximately 95% higher than Pre-IPO levels.
- The median Post-IPO total direct compensation for NEOs is approximately 153% higher than Pre-IPO levels, while the 25th percentile is approximately 73% higher, and the 75th percentile is approximately 199% higher. The average Post-IPO NEO total direct compensation is approximately 91% higher than Pre-IPO levels.
Annual and Long-Term Incentive Compensation
- At the median, Post-IPO target bonus opportunities (as a percentage of base salary) were larger than Pre-IPO target bonus opportunities. The median CEO target bonus opportunity was 50% Pre-IPO and 76% Post-IPO, while the median CFO and NEO target bonus opportunity were 50% Pre-IPO and 60% Post-IPO and 45% Pre-IPO and 50% Post-IPO, respectively.
- Pre- and Post-IPO, LTI compensation is the largest component of compensation for each of the executive groups. At the median, Post-IPO LTI makes up 69% of CEO total compensation (compared to 68% Pre-IPO). Similarly, Post-IPO LTI makes up 64% and 62% for CFOs and NEOs – compared to 58% and 57% Pre-IPO, respectively.
Conclusion
An IPO brings about both significant opportunities and various challenges. One such challenge is revising existing executive compensation programs to better align with public company practices and specifically with key public competitors. Failure to do so may hinder your ability to recruit top talent and could result in the loss of current executives. Staying informed about the latest market trends and data is essential for maintaining effective executive compensation programs. Whether you are a private company considering an IPO or have already made the transition, please feel free to reach out to us with any questions.