Part 3: Detour to Vegas - How Data Analytics Was Used to Assess Caesars’ Loyalty Program
Caesars Entertainment Operating Company (“CEOC” or the “Debtor”), which owned and managed a number of Caesars’ casino properties, filed for bankruptcy protection in January 2015. CEOC was a subsidiary of Caesars Entertainment Corp. (“Holdco” or “CEC”) which also owned casino properties through two other subsidiaries: Caesars Entertainment Resort Properties (“CERP”) and Caesars Growth Partners (“CGP”). In total, the Caesars gaming empire consisted of 43 casino properties, of which 28 were owned by CEOC.
The Debtor engaged in a series of complex sales of casinos and intellectual property as well as financings and related party transactions in the years prior to the bankruptcy. After the bankruptcy filing, an Examiner[1] was appointed to investigate and report on various CEOC pre-petition transactions. Alvarez & Marsal (A&M) was retained as financial advisor to the Examiner. The Examiner concluded that the value of claims related to fraudulent transfers, breaches of fiduciary duty, aiding and abetting breaches of Caesars management and its sponsors, and other actions ranged between $3.6 billion to $5.1 billion.[2],[3]
This is the third of a four-part series highlighting some of the key investigation issues and findings of the Examiner’s report.[4] In this edition, we explore the claim that the Debtor’s (CEOC’s) customers were diverted to properties owned by non-Debtors (CGP and CERP) through the customer loyalty program, Total Rewards.
(For Part 1: Caesars’ Liquidity and Solvency, click here; Part 2: When a Fairness Opinion is Not Fair: Outdated Projections, Britney Spears and Market Multiples, click here.)
What is The Total Rewards Program?[5]
Recognized by Caesars witnesses as the “key to the empire,” Caesars utilizes a loyalty program called Total Rewards to tie together its regional “spoke” casinos with “hub” destination casinos in Las Vegas, New Orleans and Atlantic City. Once customers join the Total Rewards program, they are issued membership cards and may present those cards when incurring any on-property entertainment expenses, including gaming, dining, hotel stays and retail shopping. In return, Total Rewards members receive and accumulate Reward Credits that may be redeemed for all gaming and hospitality purposes at any Caesars property, as well as some limited perks at partner companies. According to Caesars, the enterprise-wide emphasis of Total Rewards, which focused on maximizing the overall EBITDA of Caesars rather than a property, created a “network effect” that gave Caesars an advantage over its peers.
At the core of Total Rewards is a sophisticated database containing a huge amount of customer information.[6] On a macro level, this information (of a type known as “Big Data”) is used to track more general customer preferences, allowing Caesars to adjust its business and marketing strategies to increase profitability. On a micro level, this Big Data is used to determine a customer’s average “spend” during a given visit and to identify its most valuable customers. One consequence of these efforts is that a significant percentage of the gaming “play” in its casinos is cross-market play, where play is generated from customers crossing over from one Caesars property to another (“Cross-Play”).
Were CEOC Customers Diverted to Properties Owned by CGP or CERP?[7]
One of the claims asserted by some creditor groups was that Caesars used Total Rewards to identify the Debtor’s (CEOC’s) best customers and direct them to properties owned by CERP and CGP (non-Debtor, non-CEOC properties) through marketing offers, without compensating CEOC for generating this cross-property revenue. To investigate this claim, the Examiner performed a detailed review and analysis of Caesars’ Total Rewards program, including using data analytics on the 43 casino properties under Caesars’ gaming empire.
Any Distinction in Marketing Activities?[8]
First, the Examiner observed that the data generated from the Total Rewards program is used to target customers with specific marketing promotions or hospitality products. Moreover, in generating customer offers, Caesars increases the yield from its fixed inventory (i.e.., hotel rooms) by analyzing a customer’s worth (defined as a customer’s gaming and ancillary spending) against the displacement cost of giving a room to a Total Rewards customer versus selling it on the open market. In that regard, it does not appear as if Caesars makes any distinction between specific properties in its portfolio; rather Caesars sought to maximize the overall EBITDA of an overall market, as opposed to a particular property.
Did Banked Reward Credits Reflect a Bias?[9]
Next, the Examiner assessed the Reward Credits accumulated over time. Between 2012 and 2015, the amount of Reward Credits earned approximated the amount redeemed; meaning members tend to earn and redeem credits at the same property.[10] In 2014, for instance, 89 percent of the Reward Credits earned at CEOC properties were redeemed at CEOC properties, and only 20 percent of the Reward Credits earned at non-CEOC properties were redeemed at CEOC properties. As a result, the net liability for Reward Credits between properties was relatively modest.
Were Property Values Increased?[11]
Third, the Caesars witnesses were in uniform agreement that the Company’s hub-and-spoke operating model makes its properties more valuable within the Total Rewards “system” than they otherwise would be. Similarly, Holdco management also contends that a property removed from Total Rewards decreases in value. The Examiner’s analysis of property values supports these conclusions. For example, in May 2004, Harrah’s Shreveport was sold to Boyd Gaming, and thus was extracted from the Total Rewards program. In the following year, revenues declined by 12.8 percent. Conversely, a review of four properties acquired in Las Vegas and therefore within the Total Rewards system – Caesars Palace, Imperial Palace, Flamingo and Planet Hollywood – revealed significant increases in EBITDA and gaming after joining the Total Rewards program, as well as increases between 5 percent and 27 percent in dining and 11 percent and 29 percent in retail.
Were Incremental Revenues and Synergies Generated?[12]
Fourth, the Company touted the Total Rewards program stating it enabled Caesars’ key markets to generate considerable revenues from customers not originally playing at that property; a phenomenon referred to as “Cross-Play.” More specifically, Total Rewards attempts to create synergies between Caesars’ broad network of properties.
Under this model – in which Las Vegas operates as the “hub” to the regional “spokes” – members of Total Rewards accumulate credits in their home market (at what is considered Caesars’ regional properties) and are incentivized to travel to destination markets such as Las Vegas. Caesars believed the regional properties benefit financially from an affiliation with Total Rewards because the appeal of destination rewards encouraged customers to visit the regional properties to earn reward credits.
Given this structure, there is an inherent risk that the Total Rewards program (and accompanying marketing promotional program) could be used to redirect or influence CEOC customers to use other, non-CEOC properties within the Caesars enterprise. However, the Examiner did not uncover any evidence that Caesars used Total Rewards to intentionally divert business to Non-CEOC properties. Incentives to visit a particular property are not based on the credit to which that property belongs, and a customer is typically given the option of selecting among various qualifying properties based on his or her Tier level, regardless of corporate ownership.
Did Cross-Play Have a Financial Impact?[13]
Finally, Cross-Play did result in a significant amount of the gaming revenue earned by Caesars properties on an annual basis. To assess the impact of Cross-Play, the Examiner analyzed the Theoretical Win (“Theo”)[14] gaming revenue to make observations related to the imports and exports from certain Dominant properties to other properties (i.e., properties played) for the period 2011 through 2015.[15] Data analytics were applied to Theo gaming revenue data that reached over 1.1 million line items and related to approximately 43 different Holdco casino properties. More specifically, the Examiner made observations regarding the historical “hub” and “spoke” Cross-Play relationships by:
- Securing large volumes of files with over 1.1 million lines of monthly Theo gaming data for the period 2011 through 2015.
- Merging Theo gaming files with legal entity owners of each casino property.
- Applying various filters and stratifications to isolate and review specific Theo gaming data such as by calendar year, Dominant market (e.g., Las Vegas), Dominant property owner, played property owner or market played (e.g., Regionals).
- Summarizing and analyzing the data filtered results, by month/year and by casino property played, for each period to assess the impact of the Theo Cross-Play.
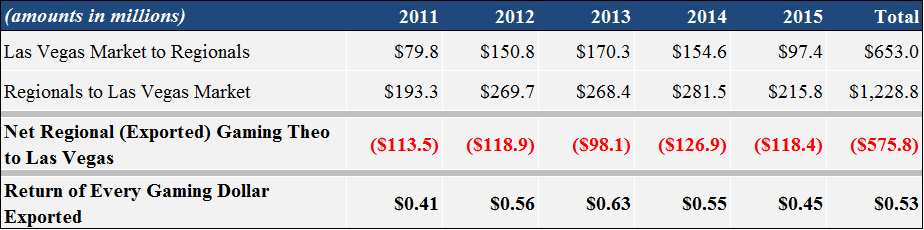
The Theo related observations were then grouped based on (i) the general hub and spoke premise and (ii) by legal entity (i.e., CEOC vs CERP and/or CGP). For example, as shown in Table 1, the regional properties were net exporters of Theo gaming revenue to Las Vegas from 2011 to 2015. The regional properties recovered an average of 53 cents on the dollar of the exported play to the Las Vegas properties.
Table 1 – Gaming Theo Cross-Play – Regional Properties vs. Las Vegas Market
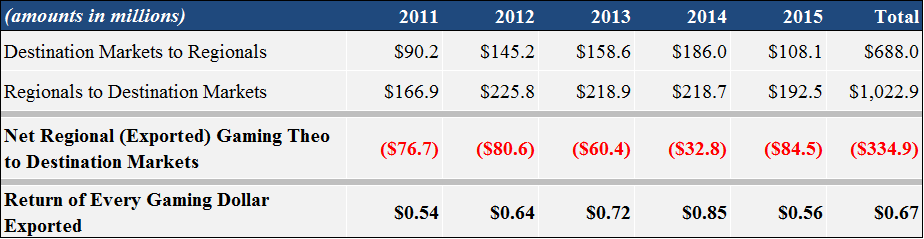
Similarly, the regional properties were net exporters of Theo gaming revenue to destination properties including Las Vegas, Atlantic City and New Orleans (See Table 2). The regional properties recovered an average of 67 cents on the dollar of the exported play to the destination properties.
Table 2 – Gaming Theo Cross-Play – Regional Properties vs. Destination Markets
Thus, while Total Rewards impacts the financial results of all the Caesars properties, there are varying views on which type of property (i.e., regional or destination) benefit the most from being part of the system. It is difficult to know whether the customer would have played as much or more at the regional property if he or she was not in the Total Rewards program or if the regional customer belonging to Total Rewards did not go to Las Vegas. It appears that such determination depends on a host of factors, including that customer’s personal preferences as well as the amount of local competition faced by the regional property.
What about the Cross-Play Generated by CEOC?[16]
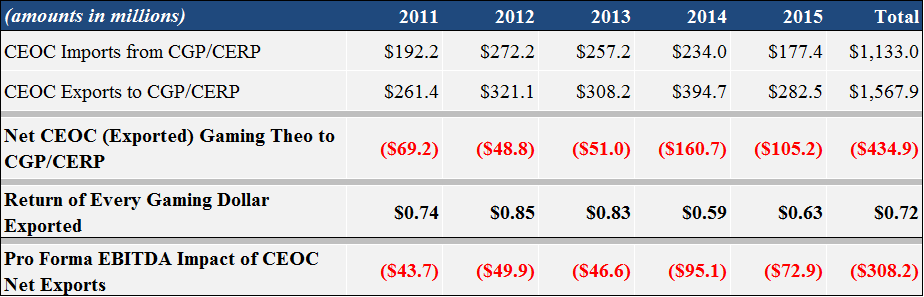
It does appear that, given the “hub-and-spoke” system and the various asset transfers during 2013 and 2014 between and among the Caesars entities, net Cross-Play inures more to the benefit of CGP and CERP than it does to CEOC, which is now made up predominantly of regional properties. As shown in Table 3, the net Theo gaming Cross-Play between all the CEOC properties and all the CGP and CERP properties (combined) indicates that CEOC exported more customer dollars to CGP and CERP properties than vice versa. Specifically, CEOC recovered an average of 72 cents on the dollar of its exports to CGP and CERP combined.
Table 3 – Gaming Theo Cross-Play – CEOC vs. CGP/CERP Properties
Additionally, CEOC has historically received no consideration in exchange for customers sourced at CEOC regional properties who visit non-CEOC properties in Las Vegas or elsewhere. By contrast, for example, where customers are referred by CEOC to CIE (Caesars online, mobile and social gaming company) an agreement between the two companies obligates CIE to pay a fee to CEOC for such referrals. No similar arrangement benefitting CEOC exists within the Caesars enterprise.
Assessment of Claim & Conclusion[17]
As noted above, some creditor groups asserted that Total Rewards was used to identify CEOC’s best customers and direct them to CERP and CGP without compensating CEOC for generating this cross-property revenue. Although there is evidence CEOC was a net exporter of Theo gaming revenue, the Examiner concluded this observation is insufficient to give rise to anything more than a speculative claim for damages. For one thing, CEOC properties, including regional properties, benefited from being part of Total Rewards, although the extent of that benefit is difficult to measure. Moreover, it is simply too speculative to assume the benefit of Cross-Play to CERP and CGP properties was something that could have been controlled by Holdco, as CEOC’s majority shareholder. Ultimately, it is the customer’s choice at which property (or properties) to game, and there is no evidence Caesars attempted, or was able, to manipulate customer choice.
[1] The bankruptcy code allows for the appointment of an examiner who shall perform an investigation of the acts, conduct, assets and financial condition of the debtor and other duties as ordered by the court.
[2] Examiner’s Report at p. 78-80.
[3] The Financial Times’s blog, FT Alphaville, describes the Examiner’s report: “For anyone who has followed the machinations at Caesars, the blow-by-blow accounts behind all the deals makes for an incredible read — the first 100 or so pages of executive summary has plenty of dirt. And even if you have not, just reading the lengths private equity firms will go to salvage bad investments is mind-blowing.” (https://ftalphaville.ft.com/2016/04/11/2158973/liquidity-v-solvency-caesars-edition/)
[5] Examiner’s Report at p. 669-672, 674-675 and 681.
[6] [Total Rewards is a] 300-gigabyte transactional database that record[s] customer activity at various points of sale – slot machines, restaurants, and other retail areas in our properties. See Diamonds in the Data Mine, https://hbr.org/2003/05/diamonds-in-the-data-mine. (Examiner’s Report at p. 674).
[7] Examiner’s Report at p. 709.
[8] Examiner’s Report at p. 675.
[9] Examiner’s Report at p. 675-678.
[10] Examiner’s Report at p. 677.
[11] Examiner’s Report at p. 682-685.
[12] Examiner’s Report at p. 679-680 and 694-696.
[13] Examiner’s Report at p. 680, 686-688 and Appendix 10 to Examiner’s Report at p. 1.
[14] “Theo” or “Theoretical Win” is a “[m]athematical equation used to estimate how much [Caesars] theoretically believe[s] the casino will win from a customer based on probability.” Theo represents the expected house advantage from gaming activity. (Examiner’s Report at p. 686, footnote 2752)
[15] Total Rewards members are categorized by Dominant property which is generally defined as the property where the member had the highest frequency of rated visits in the prior 12-month period. For example, if a Total Rewards member with Harrah’s North Kansas City (“NKC”) as her/his Dominant property visits Planet Hollywood in Las Vegas, NKC has exported Theo gaming revenue to Planet Hollywood in Las Vegas. (Appendix 10 to Examiner’s Report at p. 1)
[16] Examiner’s Report at p. 698-699 and Appendix 10 of Examiner’s Report at p. 4.
[17] Examiner’s Report at p. 709-710.