Monte Carlo Simulations: An Example of Application
This article is the second in a series on the subject. Click here to read the first issue.
The full report, made available by BVR, entitled “Monte Carlo Simulations: Advanced Techniques” includes chapters by the author of this piece, Jason Andrews, plus colleagues Dave Dufendach and Neil Beaton.
Example of Application of a Monte Carlo Simulation
As is the case with most new concepts, an example is often necessary to be able to fully understand and apply the concept - certainly Monte Carlo simulations are no different. Thus, we are using the valuation of a relative total shareholder return restricted stock award (commonly referred to as an “rTSR”) to illustrate how to implement and interpret the results of a Monte Carlo simulation.
In our example, the rTSR award’s vesting will be based on the subject company’s stock price relative to a group of four peer companies. The vesting percentage is based on rank of return (calculated using the 20-trading day average prior to the grant date and preceding the maturity date) over the measurement period (two years), as follows:
- Rank 1st – 200 percent of shares
- Rank 2nd – 150 percent of shares
- Rank 3rd – 100 percent of shares
- Rank 4th – 50 percent of shares
- Rank 5th – 0 percent of shares
The above vesting conditions contain both conditional (rank of return) and non-linear (shares vesting dependent on rank and the value of the award is not linear with stock price) outcomes; thus, as detailed in our previous post, the valuation of the rTSR award requires a Monte Carlo simulation.
In order to value the rTSR award, simulating the stock price of the subject company and the four peer companies will be required. The most common and widely accepted method for doing so is the geometric Brownian Motion (GBM). GBM utilizes a beginning stock price (S0), risk-free rate (µ), expected volatility of underlying stock (σ), and simulated variable (ε, a random number that has a normal distribution with a mean of zero and standard deviation of one) as inputs to the following formula to simulate each company’s stock price:
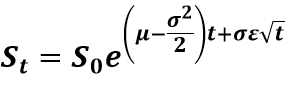
The simulation can either be done using daily time-steps or, more efficiently, using a one-time jump to the beginning of the 20-day period at the maturity then using daily time-steps (t is the time interval of the time-step).
One additional element to consider is the correlation between the subject company’s and each peer company’s stock price as these types of awards often use companies within the same industry and some level of positive correlation would be expected. Based on our experience, correlation can have a meaningful impact on the results of an rTSR award and thus we incorporate the correlation in our analysis. The correlation of the simulated stock prices for each company are addressed by applying a correlation matrix to the simulated variable (ε) for each company for each time-step. This is typically calculated based on the historical correlation of daily stock price returns between subject company and each of the peer companies, and between each peer company and all the other peer companies.
A Monte Carlo simulation consists of a large number (hundreds of thousands or millions are typically necessary to capture all the potential variability of the outcomes) of “trials” in which a new set of simulated variables (ε in our example) are selected based on defined distributions (a normal distribution is a frequently utilized distribution; however, there are many available distributions, such as log-normal, bi-modal, triangular, uniform, etc., that may be more appropriate for any simulated variable).
In our example, one trial would consist of a stock price path between the valuation date and the maturity (two years) for the subject company and each peer company, representing one potential outcome or scenario. In each trial, the return – based on the 20-trading day average preceding issuance and the simulated 20-trading day average preceding the maturity – and rank for each company would be calculated and used to determine the number of shares of the rTSR award vesting, and then the future value (shares vested multiplied by the future stock price) and present value (future value of rTSR award discounted at the risk-free rate) of the award would be determined.
At least one metric should be identified then tracked and recorded for each trial, enabling us to review and interpret the results of the Monte Carlo simulation using statistical analysis. Often, we will track several metrics within the analysis to allow us to evaluate whether the simulation is performing as expected and further understand how various assumptions/factors might be impacting the results. For example, we might track the number of shares of the subject rTSR award vesting in each trial to ensure the minimum is not less than zero and maximum is not greater than 200 percent of the total award and understand the frequency/probability of reaching each vesting threshold (tracking the rank for each company would provide some insight here as well).
In the subject example, the key metric to track would be the resulting present value of the rTSR award for each trial as the mean of all the trials would represent the conclusion of the fair value or fair market value of the rTSR award (each trial is equally likely and, therefore, given equal weight). Additionally, it might be necessary to track the time to vesting for awards with variable maturities to capture the median term for certain accounting disclosures under financial reporting.
This article originally appeared in a BVR Special Report.
About Alvarez & Marsal
Companies, investors and government entities around the world turn to Alvarez & Marsal (A&M) when conventional approaches are not enough to make change and achieve results. Privately held since its founding in 1983, A&M is a leading global professional services firm that provides advisory, business performance improvement and turnaround management services.
Learn more about A&M’s Valuation Services practice here.
The Authors
Jason Andrews is a Senior Director with Alvarez & Marsal Valuation Services in Seattle. He specializes in the valuation of public and closely-held business and business segments, financial instruments and related matters for financial statement reporting, tax reporting, corporate planning, litigation support and other purposes. His primary areas of concentration are providing valuations of early stage and venture-backed companies, share-based compensation, financial instruments and derivatives. Contact Jason at jandrews@alvarezandmarsal.com.
Dave Dufendach is a Managing Director with Alvarez & Marsal Valuation Services in Seattle. He specializes in the valuation of complex financial instruments, intangible assets, intellectual property, businesses and business segments for financial reporting, tax and other purposes.
Neil Beaton is a Managing Director with Alvarez & Marsal Valuation Services in Seattle. He specializes in the valuation of public and privately held businesses and intangible assets for purposes of litigation support (lost profits claims, marriage dissolutions and others), acquisitions, sales, buy-sell agreements, ESOPs, incentive stock options and estate planning and taxation.