Substance Abuse: A Crisis in Need of Disruption
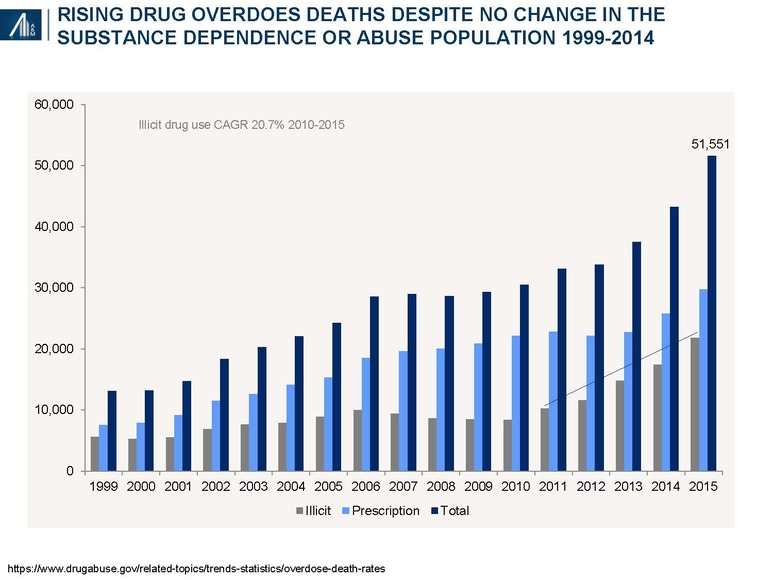
Drug overdose deaths in the U.S. are projected have reached 59,000–65,000 in 2016, a figure exceeding the peak number of automobile related fatalities (54,589) and the AIDS epidemic (50,877).1 Drug overdose deaths are now the fourth leading cause of death among Americans aged 15–65 — the prime years of life — after cancer, heart disease and unintentional injuries.3 Prescription opioids such as hydrocodone (Vicodin) and oxycodone (Percocet) account for 40–50 percent of the total.4
Heroin, formerly the scourge of poor and urban areas has now penetrated middle-to-high income suburban areas with a low cost, high potency product. Fentanyl, with 40–50x the potency of pure heroin is a contributor to the rising death toll. Alarming headlines, combined with growing evidence of death and devastation has led to an outcry for additional legislation, manpower and funding to address substance abuse and dependency disorders.
According to Kaiser Family Foundation, prior to the Affordable Care Act (ACA) substance abuse disorder services (inpatient and outpatient services) were not covered by 45 percent of 2013 non-group plans, and mental/behavioral health services (inpatient and outpatient services) were not covered by 38 percent of the non-group plans. Under the ACA, substance abuse treatment was mandated in the essential health benefits, a set of 10 service categories requiring coverage by health insurance plans.5 The ACA also required compliance with the Mental Health Parity and Addiction Equity Act.
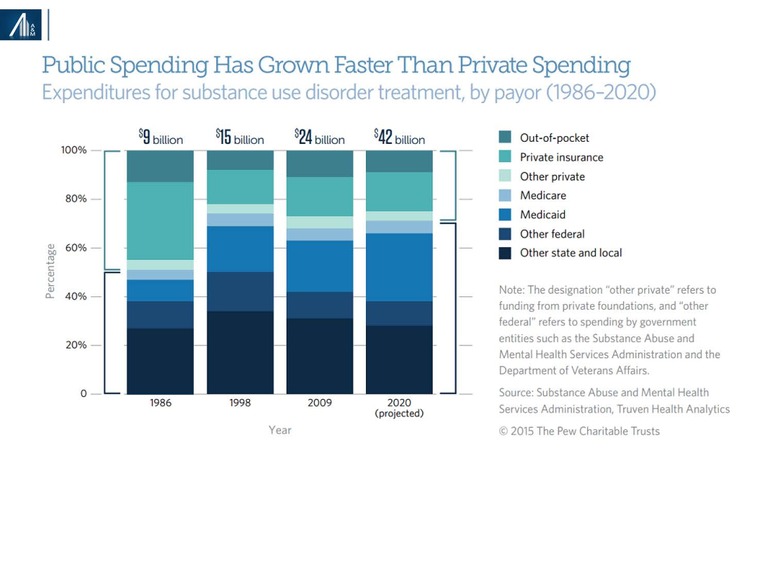
Prior to the ACA, the Substance Abuse and Mental Health Services Administration (SAMHSA) estimated the distribution of substance abuse spending as follows: 45 percent other state and local, 20 percent Medicaid, 14 percent other Federal, 7 percent private insurance, 6 percent out-of-pocket, 5 percent Medicare and 4 percent other private. Passage of the ACA increased Medicaid and private insurance coverage, the latter based on increased coverage of family members under age 26.6 Healthcare reform is likely to reverse this trend.
In recognition of this likelihood, Senate Republicans recently added $45 billion over ten years, $4.5 billion per year, to the proposed Better Care Reconciliation Act of 2017. The incremental state funding is unlikely to cover the possible exclusion of substance abuse coverage from revisions to essential health benefit requirements and the loss of coverage for 22 million Americans.
In this article, we provide an overview of the demographics of drug abuse, its etiology and treatment principles; the substance abuse and dependency disorders market, with a focus on specialty substance abuse treatment centers; public policy considerations; and the for-profit, out-of-network business model and diagnostic testing.
Key findings:
- Rising drug overdose deaths reflect increased severity (and risk) of abuse and not more users. According to federal officials, heroin at a 50–90% pharmaceutical grade is now available at $5.00 a button (0.1 gram lasting one day).
- Legislation has increased the insured pool of potential residential therapy recipients by 0.5–1.4 million, primarily through commercial coverage of children through age 26, public health exchanges and Medicaid expansion
Only 10 percent of individuals with substance abuse disorders receive specialty treatment7
- Substance abuse and dependency disorder (SUD) are multifactorial and relapsing chronic conditions. Acute treatment in a residential center does not “cure” the disease; care continuity is essential
- SUD treatment paradigm needs to be individualized, based on the number and types of illicit drugs, co-occurrence of alcohol abuse, presence of co-morbid behavioral health disorders and psycho-social, educational, vocational and other factors. A need for additional evidence-based guidelines exists inclusive of site of service and therapy duration.
- A disproportionate amount of SUD market collections is out-of-network and out-of-pocket. This particularly applies to residential treatment centers and ancillary diagnostic testing.
- Fraud has become a headline risk for the sector: Medical necessity (“appropriate and essential”); kickbacks; failure to collect co-payments, co-insurance and deductible; bundling of tests and services, etc.
- Payer scrutiny has dramatically increased, inclusive of such measures as reducing allowable rates, limiting authorization levels across various levels of care, requesting clinical documentation to review for medical necessity of services rendered and increasing audits to validate compliance with collection of patient responsibilities. These policy changes apply to contracted and out-of-network operators.
- Operating with appropriate compliance and documentation standards, combined with adherence to legal and payer guidelines for collection of patient responsibilities will be required for success going forward.
Healthcare reform, as defined by the proposed House and Senate bills, the latter subject to passage and House reconciliation, is likely to reduce federal and state funding support and exacerbate the crisis.
A&M believes fundamental business model changes will be forthcoming in the for-profit segment driven by payers, regulators and consumers. It also believes that more, rather than less, support from the federal government is essential as the trail of death and destruction continues to rise.
Rising drug overdose deaths reflect increased severity (and risk) of abuse and not more users
According to the Substance Abuse and Mental Health Services Administration (SAMHSA), 21.6 million Americans have either had a substance abuse disorder, with repeated adverse social consequences or a dependency, with associated physiologic withdrawal. Despite the headlines, the number of substance abuse patients has remained unchanged since 2000.
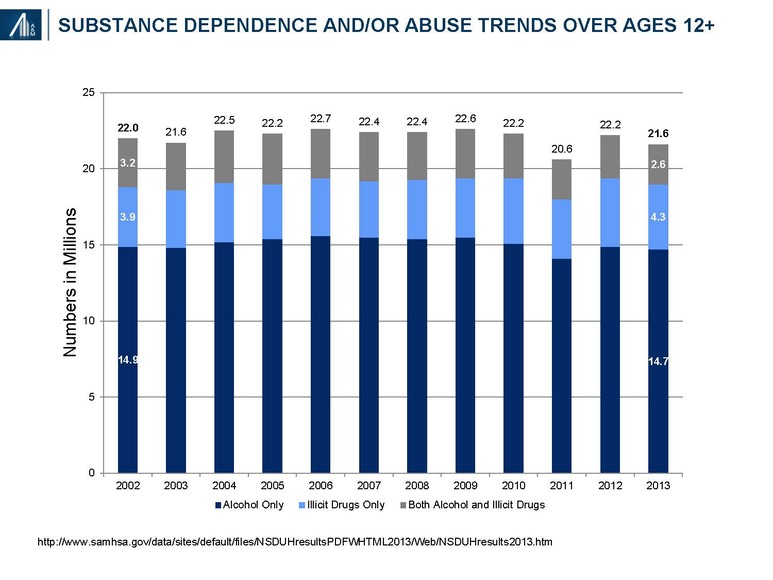
The recently published 2014 figure of 21.5 million people with a substance use disorder (SUD)—14.4 million people with alcohol use disorder (only), 4.5 million with an illicit drug use disorder (only) and 2.6 million who had both—remains relatively unchanged from the prior year.8
In 2014, there were 43,225 deaths related to prescription (60%) and illicit (40%) drug overdose, more than triple the reported deaths (13, 153) in 1999.9 Opioids account for twice as many as heroin deaths, followed by benzodiazepines (e.g., Xanax, Valium) and cocaine.
Emergency Department visits for first-Listed Diagnosis of Substance Related Disorders (CCS 661) increased from 404,643 in 2006 to 656,388 in 2013, an increase of 62%.10 The rise in ED visits also reflects the acuity of the underlying abuse disorder. An analysis of the data suggests that the majority of visitors are male (60%), relatively young (18–44: 67%, 45–64: 24%) and either uninsured (31%) or on Medicaid (29%); private payers account for 20% of the total, followed by Medicare at 15%.
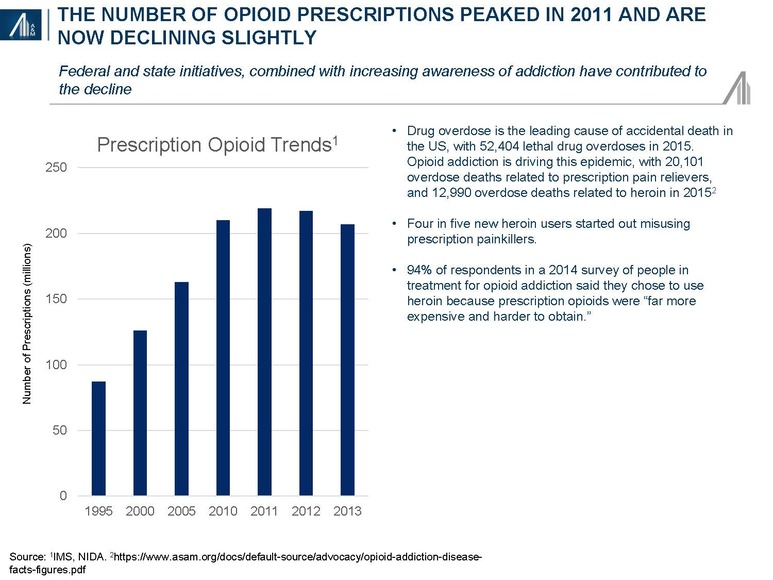
It has been estimated that 2.1 million people abuse prescription opioid pain relievers, whereas another 0.5 million are addicted to heroin.11 Contributors to prescription drug abuse include a dramatic rise in the number of opioid prescriptions written by physicians for post-operative, acute and chronic pain and increased from 126 million in 2000 to 207 million in 2013, combined with the increased social acceptability of hydrocodone (Vicodin) and oxycodone (Percoset).12 Fentanyl, inexpensive, readily available and 40–50x the potency of pharmaceutical grade, 100% pure heroin (itself 80–100x that of morphine) has become a major contributor to the rise in overdose deaths.13
Other substances of abuse include alcohol (16.6M), cocaine (855k), stimulants (469k), tranquilizers (423k) and hallucinogens (277k). Combined alcohol and drug use, as well as poly-pharmacy, among drug abusers are common. Marijuana is used by 4.2M people and is considered legal for medical purposes in 18 states and for recreational use in four.
The number of patients reported in treatment (during the late-March SAMHSA survey period) increased from nearly 1,092,546 in 2003 to 1,249,629, + 14.4% in the years between2003 and2013.14
Legislation increased insured pool of potential residential therapy recipients by 0.5–1.4 million
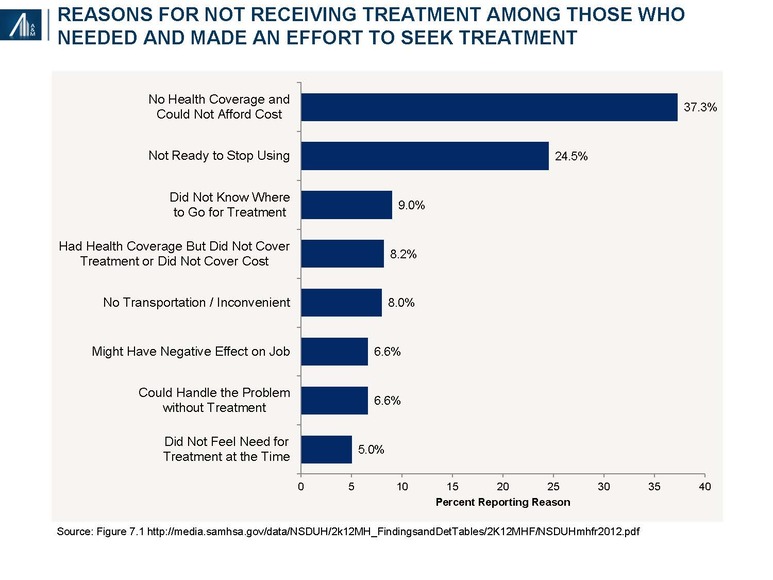
Approximately 4.1 (19.0%) of the 21.6 million Americans with substance abuse and / or dependence disorders seek treatment; of these, 2.5 million (61.0%) receive treatment during the year.15
Among the reasons for not receiving treatment cited from 2010 to 2013 includes lack of coverage, cost and access—barriers subsequently affected by the Patient Protection and Affordable Care Act (PPACA) and the Mental Health Parity and Addiction Equity Act (MHPAEA) of 2008.
The number of uninsured 18–64-year-olds has declined from 40.3 million in 2012 to 25.3 million in September 2015, a decline of 37.2%.16 Assuming a 3.0% prevalence rate of illicit drug use (+ / - alcohol) and 9.2% of alcohol abuse (+ / - illicit drugs) implies an incremental 450,000 to 1.4 million SUD patients receiving insurance coverage.
Contributing to the decline is the Patient Protection and Affordable Care Act (PPACA)-mandated coverage of 18–26-year-old children under parental health plans, affecting 3.0 million young adults; use of health exchanges by individuals and families with incomes between 1.33 and 4.0x the Federal Poverty Level, representing an incremental 3.8 million people; and Medicaid expansion in 32 states, affecting 8.2 million non-elderly individuals with incomes at or below 133 percent of FPL.17
The Mental Health Parity and Addiction Equity Act (MHPAEA) of 2008 provides for equal coverage between mental health services and physical medical health services:18
- Applies to plans sponsored by private and public sector employers with more than 50 employees, including self-insured as well as fully insured arrangements; and health insurance issuers who sell coverage to employers with more than 50 employees.
- Requires group health plans and health insurance issuers to ensure that financial requirements (such as co-pays, deductibles) and treatment limitations (such as visit limits) applicable to mental health or substance use disorder (MH/SUD) benefits are no more restrictive than the predominant requirements or limitations applied to substantially all medical / surgical benefits.
- If a plan or issuer that offers medical / surgical benefits on an out-of-network basis also offers MH / SUD benefits, it must offer the MH / SUD benefits on an out-of-network basis, as well.
- Although MHPAEA provides significant new protections to participants in group health plans, it is important to note that MHPAEA does not mandate that a plan provide MH / SUD benefits. Rather, if a plan provides medical / surgical and MH / SUD benefits, it must comply with the MHPAEA’s parity provisions.
In February 2016, President Obama's proposed budget for 2017 included $1.1 billion in new mandatory funding to expand access to drug addiction treatment.19
On March 28, 2016, the Centers for Medicare and Medicaid Services (CMS) finalized a rule that is expected to increase access to mental health and substance use services for 23 million low-income Americans with coverage under Medicaid by (a) “requiring insurance plans [Managed Medicaid] to disclose information on mental health and substance use disorder benefits upon request, including the criteria for determinations of medical necessity and (b) mandating that states disclose the reason for any denial of reimbursement or payment for mental health and substance use disorder services rendered”.20
Healthcare reform would reverse the limited gains associated with Obamacare
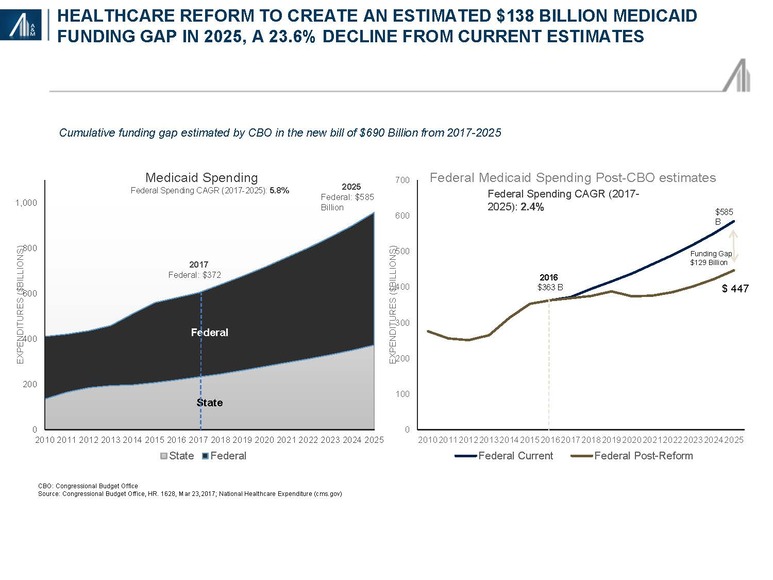
The Congressional Budget Office scoring of the American Healthcare Act estimated a $834 billion cumulative reduction in Medicaid spending in 2017–2026.21 An A&M comparison with publicly available CMS National Healthcare Expenditure data through 2025 (i.e., 2026 projections are not yet available) suggests a decline in the Medicaid compound annual growth rate from 5.8 percent to 2.4 percent. The calculated spending gap of $138 billion will be required to be met by the states or more likely, result in significant reductions in spending. The aged and disabled, despite accounting for only 25 percent of Medicaid beneficiaries, account for 66 percent of spending; children represent 46 percent of beneficiaries and 16 percent of spending. Adults, including those with substance abuse disorders, are likely to bear the “brunt” of any cutbacks.22
Substance abuse and dependency disorder (SUD): A multifactorial and relapsing chronic condition
The direct cost of substance abuse treatment (2014: $31 billion), is dwarfed by the indirect costs (2011: $193billion) driven by lost productivity ($120billion), crime ($61billion) and non-homicide and other health costs ($12billion).23 The indirect cost figure does not include the cost of family disintegration, domestic violence or child abuse.
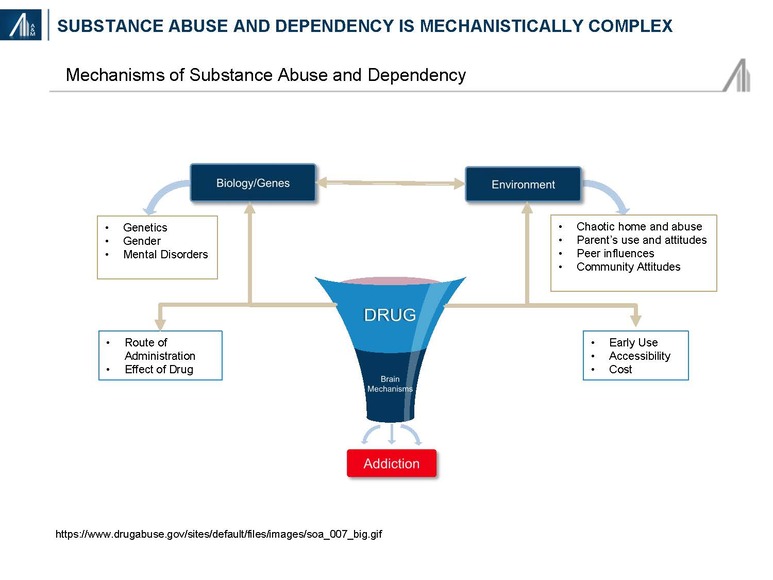
Understanding the profile of SUD patients could explain the chronicity and high indirect costs. Mechanistically, substance abuse and dependency disorders have multiple risk factors including genetics, the environment and actual changes to the brain structure and function.
Nearly one-half to two-thirds of SUD patients in treatment centers have a dual diagnosis inclusive of co-morbid mental health disorders such as depression, anxiety, bipolar disease, traumatic distress and / or conduct disorders (aggressive conduct, and deceitful and destructive behaviors).24
This compares unfavorably with a U.S. adult population rate of any mental illness (AMI) among those 18 years and older of 18.1% and serious mental illness (SMI) of 4.1%.25 The labor participation rate of 25–50% is significantly below the U.S. average of 63%.26 Education is also lagging with 6% having elementary school up to Grade 8, 27% having 9–11 years of education, 33% graduating from high school and 34% having some college.27 Despite the potential for harmful consequences, compulsive drug seeking and use often results from prior exposures affecting brain centers involved in “reward and motivation, learning and memory, and inhibitory control over behavior”.28
SUD treatment is multi-dimensional incorporating specific efforts to stop using drugs, maintain a drug-free lifestyle, and achieve productive functioning in the family, at work, and in society. A litany of mental health, medical, educational, social, legal, psychosocial and vocational needs require consideration. Treatment must also be appropriate for age, race, ethnicity and gender. According to the National Institute on Drug Abuse (NIDA), participation in residential or outpatient treatment for less than 90 days is of limited effectiveness, whereas for methadone maintenance, a minimum of 12 months is required to become effective.29 Recovery is a long-term process subject to periodic relapse that may necessitate several residential stays.
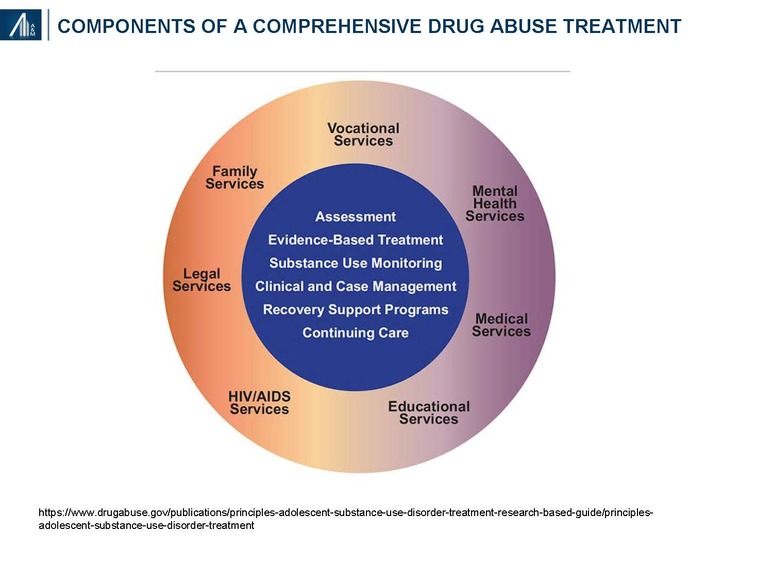
Thirteen principles of effective treatment have been defined by NIDA and include:29
- Addiction is a complex but treatable disease that affects brain function and behavior
- No single treatment is appropriate for everyone (i.e., varies by type of drug and patient characteristics)
- Treatment needs to be immediately available and readily accessible
- Effective treatment attends to multiple needs of the individual, not just his or her drug abuse
- Remaining in treatment for an adequate period of time is critical. NIDA states: “Research indicates that most addicted individuals need at least 3 months in treatment to significantly reduce or stop their drug use and that the best outcomes occur with longer durations of treatment.”
- Behavioral therapies—including individual, family or group counseling—are the most commonly used forms of drug abuse treatment
- Medications are an important element of treatment for many patients, especially when combined with counseling and other behavioral therapies
- An individual’s treatment and services plan must be assessed continually and modified as necessary to ensure that it meets his or her changing needs
- Many drug-addicted individuals also have other mental disorders
- Medically assisted detoxification is only the first stage of addiction treatment and by itself does little to change long-term drug abuse
- Treatment does not need to be voluntary to be effective; e.g., family, employment and criminal justice incentives
- Drug use during treatment must be monitored continuously, as lapses during treatment do occur
- Treatment programs should test patients for the presence of HIV / AIDS, hepatitis B and C, tuberculosis and other infectious diseases, as well as provide targeted risk-reduction counseling, linking patients to treatment if necessary
Federal, state and local governments: Slow and inadequate progress
Given the intractable abuse of opioid drugs and its impact, spending by local, state and federal government have increased, though at an insufficient rate. The primary focus of federal, state and local initiatives include:
- Reducing the inappropriate use of prescription drugs
- Expanding access to effective treatment for substance abuse
According to the Center for Disease Control and Prevention (CDC), “an estimated 1 out of 5 patients with non-cancer pain or pain-related diagnoses are prescribed opioids in office-based settings. From 2007–2012, the rate of opioid prescribing has steadily increased among specialists more likely to manage acute and chronic pain. Prescribing rates are highest among pain medicine (49%), surgery (37%), and physical medicine / rehabilitation (36%). However, primary care providers account for about half of opioid pain relievers dispensed.”30
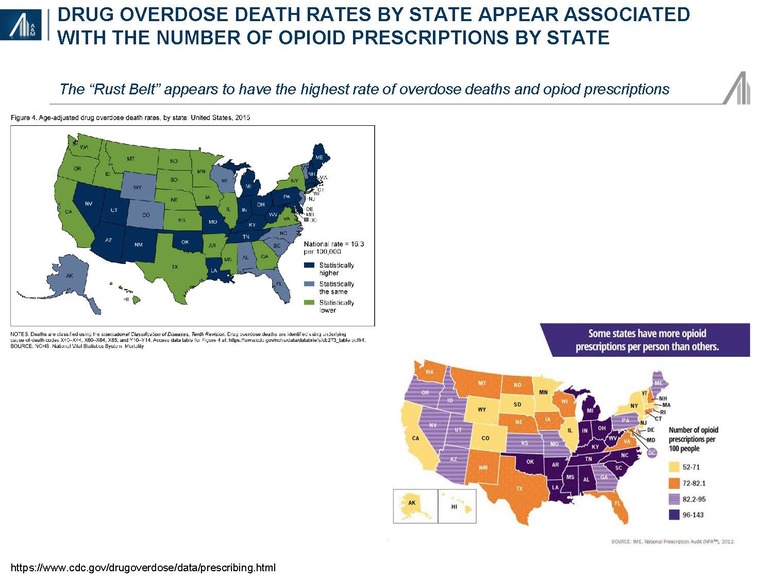
Some 2.0 million Americans suffer from prescription opioid abuse or dependency; another 4.3 million adolescents and adults have reported nonmedical use of prescription opioids.31 The impact of the opioid epidemic varies by state.
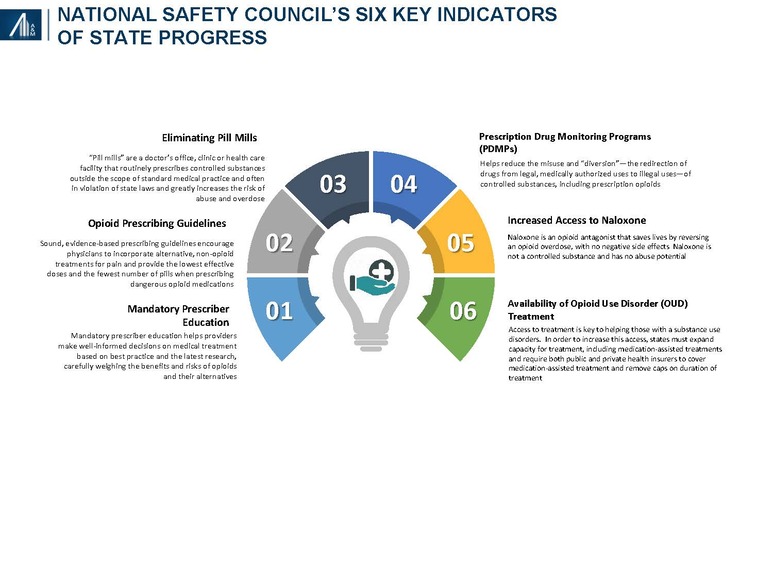
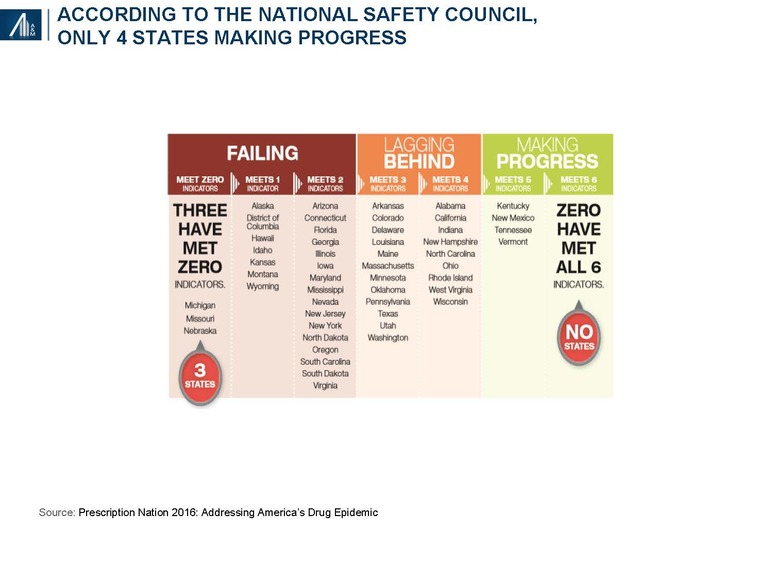
The National Safety Council examined six key indicators of progress, including mandatory prescriber education, opioid prescribing guidelines, eliminating pill mills, prescription drug monitoring programs (PDMPs), increased access to Naloxone and the availability of opioid use disorder (OUD) treatment. Prescriptions are declining, albeit slowly. Florida, formerly branded as the "pill mill capital" of the U.S., has significantly reduced the number of prescriptions from the state's top opioid prescribers since the implementation of legislation in 2015.32 PDMPs have been relatively ineffectual since implementation in 2002, although the recent availability of interoperable clinical data may increase its effectiveness.
Only four states have met five of the indicators — Kentucky, New Mexico, Tennessee and Vermont — whereas 25 are have met two or fewer indicators and are deemed to be “failing.”
Funding estimates by the Pew Charitable Trust from 2015 are already in jeopardy. The House and proposed Senate healthcare reform bills would significantly reduce the funding available through Medicaid and elsewhere.
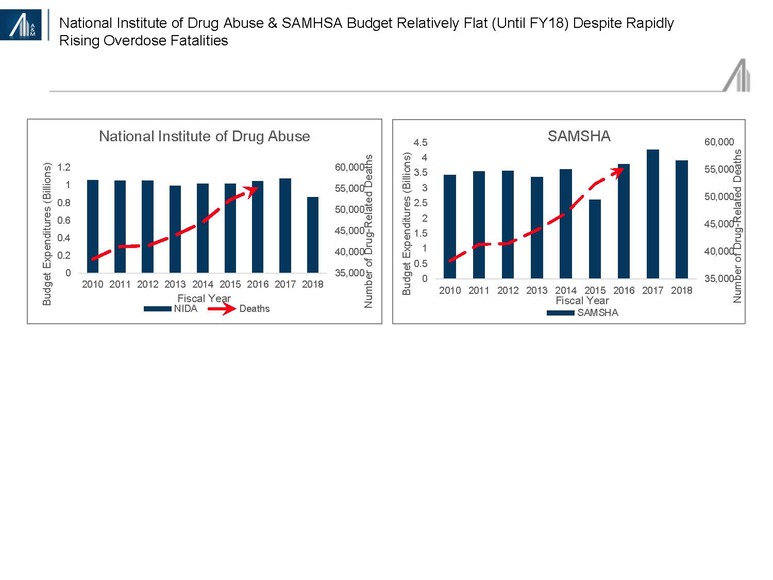
Unrelated to healthcare reform efforts has been President Trump’s effort to reduce non-military spending. Despite the opioid epidemic, funding for SAMHSA and NIDA is projected to decline 10–20 percent in FY18 (beginning October).33
Industry overview: Substance abuse and dependency disorder (SUD) market
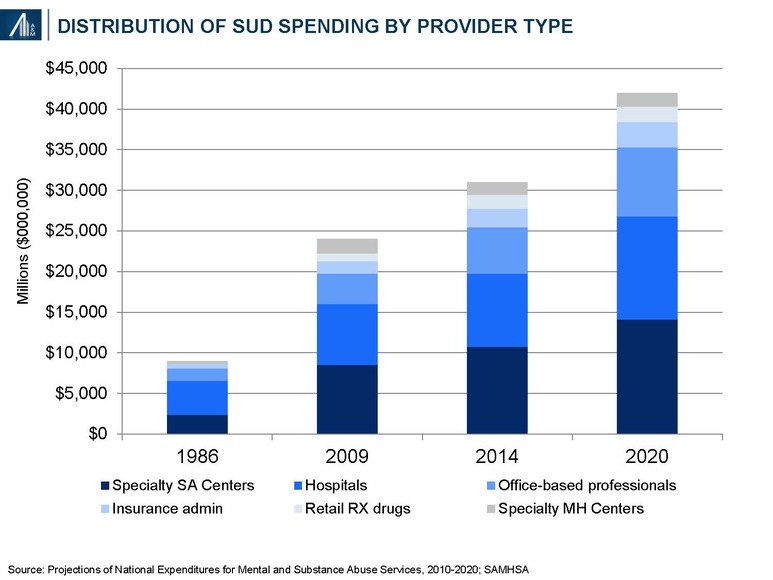
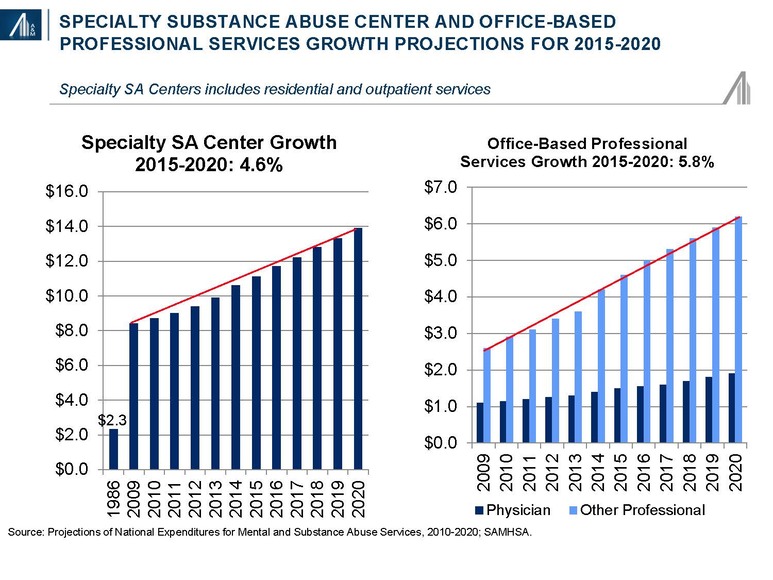
The substance abuse and dependency market approximated $31 billion in 2014, and is forecast to reach $42 billion, +35% in 2020, reflecting a 5.2% compound annual growth rate (CAGR).34 The market is divided into six segments, the largest being specialty substance abuse centers, hospitals (primarily involved in short stay detoxification) and office-based professionals. Retail (non-hospital) drugs are primarily used to treat co-morbid behavioral health issues and heroin addiction, known for severe drug carvings.
Definitions:
- Hospital care includes (a) General hospitals: community medical or surgical and specialty hospitals other than MH and SA specialty hospitals providing diagnostic and medical treatment, including psychiatric care in specialized treatment units of general hospitals, detoxification and other MHSA treatment services in inpatient, outpatient, emergency department and residential settings; and (b) Specialty hospitals: hospitals primarily engaged in providing diagnostic, medical treatment and monitoring services for patients with mental illness or substance use diagnoses
- Other professional services: care provided in locations operated by independent health practitioners other than physicians and dentists, such as psychologists, social workers and counselors.
- Physician services: independently billed services provided by Doctors of Medicine (M.D.) and Doctors of Osteopathy (D.O.), plus the independently-billed portion of medical laboratory services.
- Specialty MH centers: organizations providing outpatient and / or residential mental health services and / or co-occurring mental health and substance abuse treatment services to individuals with mental illness or with co-occurring mental illness and substance use diagnoses.
- Specialty SA centers: organizations providing residential and / or outpatient substance abuse services to individuals with substance use diagnoses.
Strong growth is projected for specialty substance abuse centers and office-based professional services due to the rising demand associated with increased coverage and rising severity of addiction.
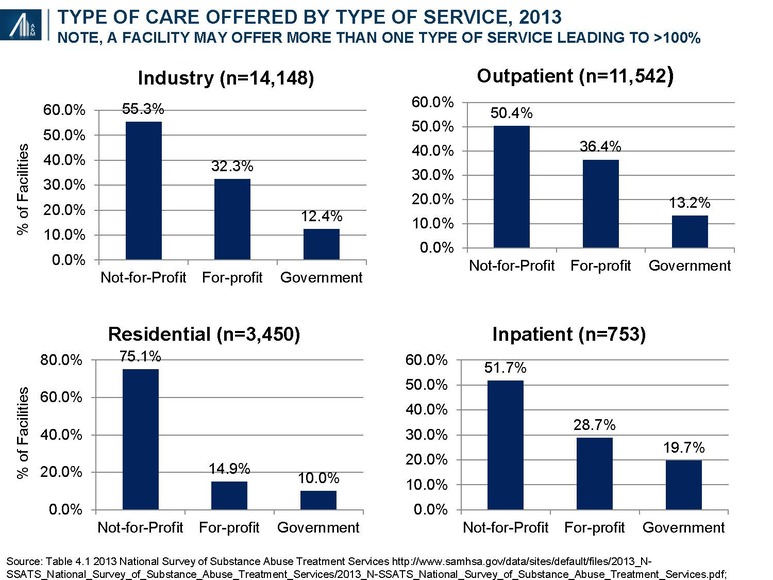
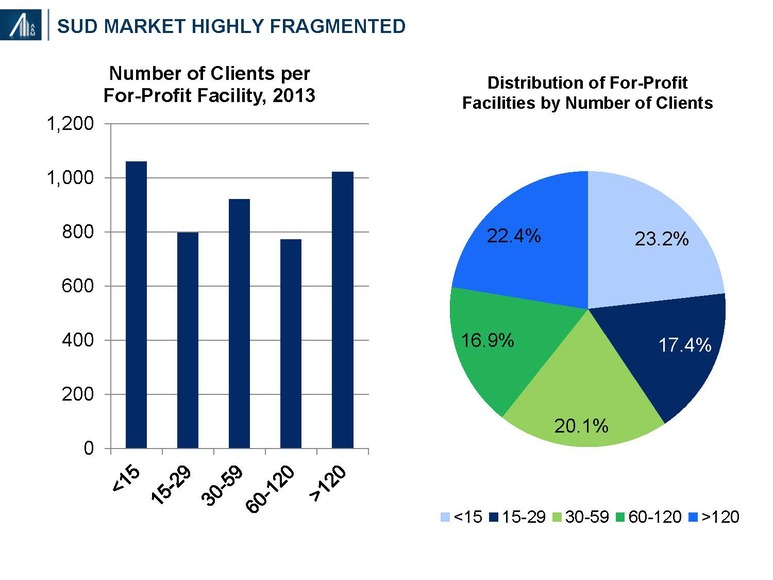
Approximately two-thirds of institutions participating in SAMSHA’s annual survey are either not-for-profit or government-led entities; the remaining one-third is for-profit. The number of for-profit facilities has increased from 3,403 (25.0% of total) in 2003 to 4,574+34% (32.3% of total) in 2013.
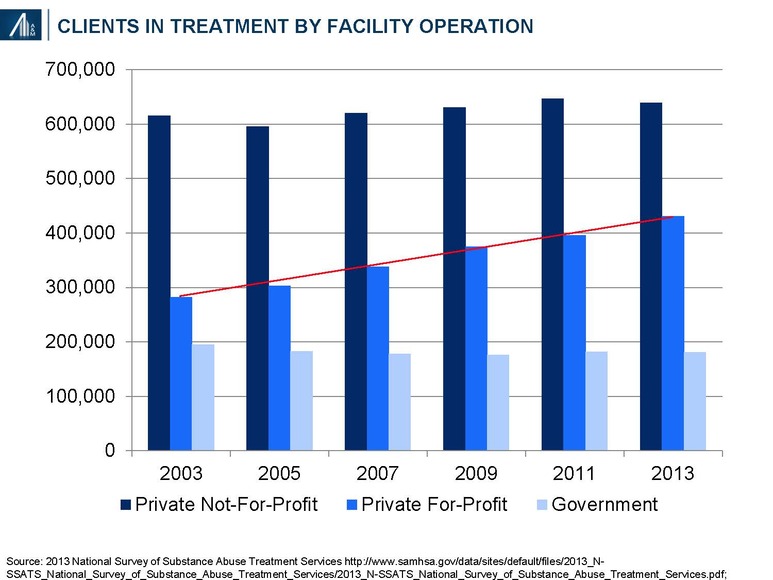
During this period, the number of clients in for-profit outpatient and residential SUD treatment increased from 282,161 (25.8% of total) to 430,362, +53% (34.4% of total).
Data is available on 103,776 (96.3%) of the 107,727 designated beds in SUD treatment centers during the late-March SAMHSA survey period: 78,754 are in private not-for-profit facilities (75.9%), 15,712 in private for-profit facilities (15.1%) and 9,310 in government facilities (9.0%).35 The number of beds per SUD residential treatment facility for private not-for-profit (30.4), private for-profit (30.5) and government facilities (27.0) are similar.
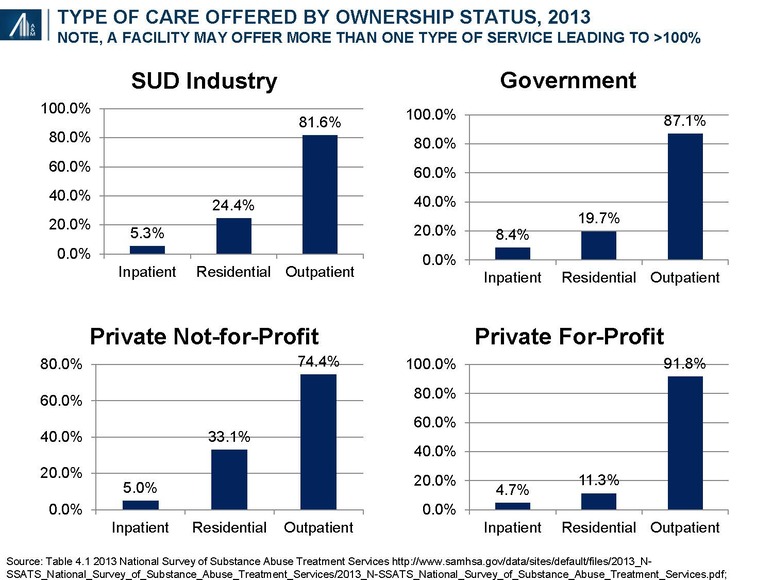
For-profit entities tend to be over-represented (relative to the overall industry average) in outpatient facilities (91.8%) and under-represented in residential facilities (11.3%).
The private for-profit SUD market remains highly fragmented, with 60.7% of facilities having fewer than 60 clients per year. The distribution of not-for-profit facilities is somewhat similar.36 The largest for-profit provider, Acadia CRC Health, established in 2005 and publicly-traded, has 216 U.S. facilities; the number of residential SUD centers remains unknown.
Treatment paradigm and payment under increased scrutiny by commercial payers
Private payers account for 29% of total spending—out-of-pocket (9%), commercial (16%), other (4%)—whereas, public payers account for 71%—Medicaid (28%), other state and local (28%), federal programs (10%) and Medicare (5%). An analysis of Emergency Department payer mix based on insurance status (not spending) suggests a payer distribution led by Medicaid (29%) and the uninsured (31%), followed by private pay (20%), Medicare (15%) and other (4%).37 It’s not inconceivable that 24% of patients (private pay, other) account for 29% (or higher) of total SUD market spending.
Commercial payers, historically willing to pay for a broad range of in-network and out-of-network services, are increasing their scrutiny of the approach to treatment, specific service offerings, site and duration of service and payment model. Approaches to treatment are complex given the multitude of illicit drugs, potential for concomitant alcohol abuse, co-morbid behavioral disorders, range of social, vocational and legal issues, and the possibility of HepC, HIV and other transmittable diseases. Scientific evidence beyond anecdotal and expert opinions, and perhaps, observational studies (case reports, case series, case control studies and cohort) are somewhat limited.
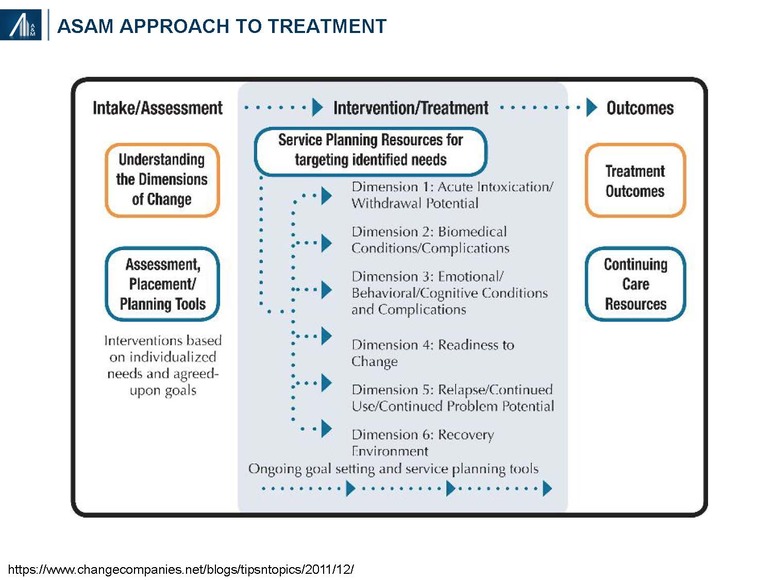
The American Society of Addiction Medicine (ASAM) “structures multidimensional assessment around six dimensions to provide a common language of holistic, bio-psychosocial assessment and treatment across addiction treatment, physical health, and mental health services, which addresses as well the spiritual issues relevant in recovery”.
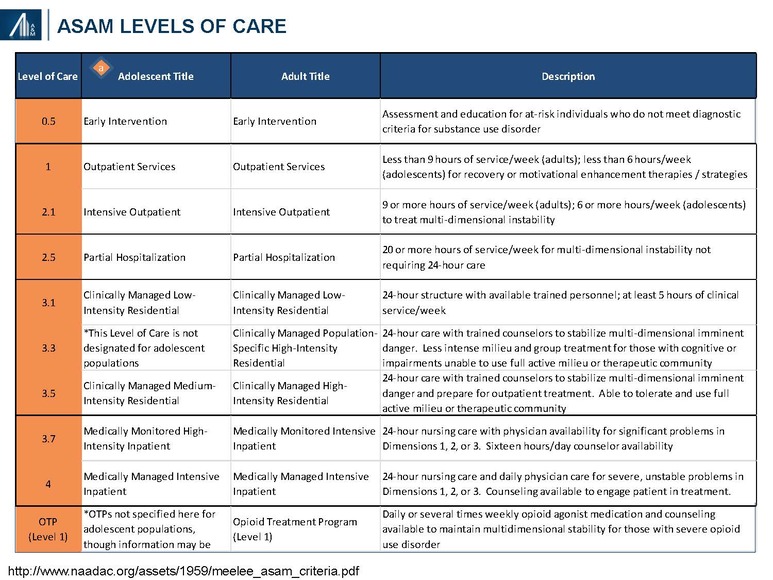
ASAM has also identified four levels of service based on daily requirements for physician care, nursing care, counseling and other services; and the ability of the patient to use a full active milieu or therapeutic community.
Sites of care may include inpatient hospitals, residential services, “safe houses” and outpatient centers. Third-party insurers cover the cost of residential treatment, including the related “room and board”, only when deemed “medically necessary” (typically 2–4 weeks). Patients potentially benefiting from longer stays at the treatment facility may choose to personally cover the “room and board” cost of staying on campus in non-medical housing.
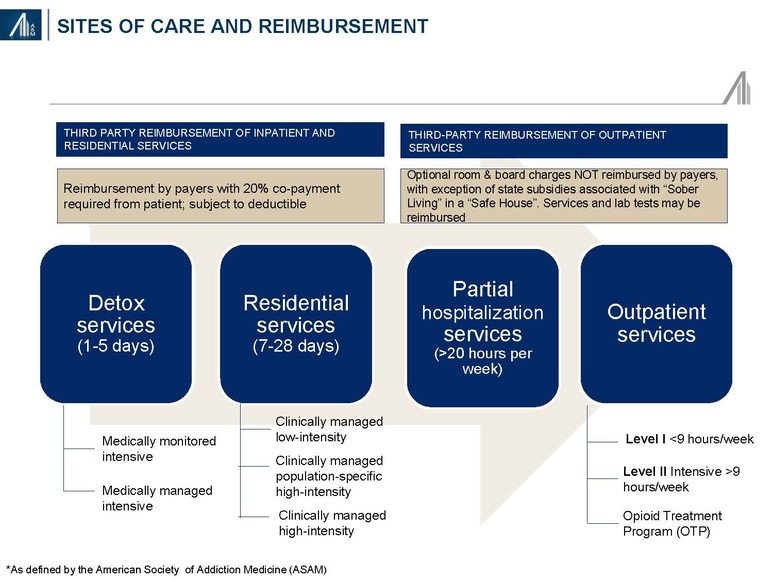
Detoxification, a medically supervised program to manage the acute physical symptoms of withdrawal associated with stopping drug use, may occur in a hospital or residential center. Detoxification may include cravings, mood and sleep disturbances, flu-like and other symptoms (e.g., pain, tremors), confusion, seizures and hallucinations. The severity of withdrawal reflects the type and amount of drugs and / or alcohol, duration of abuse and presence of mental and physical co-morbidities.38 Methamphetamine and crack cocaine addicts do not require detoxification.
Residential (non-hospital) services may include medically managed detoxification, and clinically managed short-term (<30 days) and longer-term (>30 days) stays
Outpatient services include <9 hours / week (regular), 9–20 hours / week (intensive or IOP), >20 hours / week (partial hospitalization or PHP); and outpatient treatment programs (methadone or buprenorphine maintenance and / or or Vivitrol® (naltrexone) treatment)
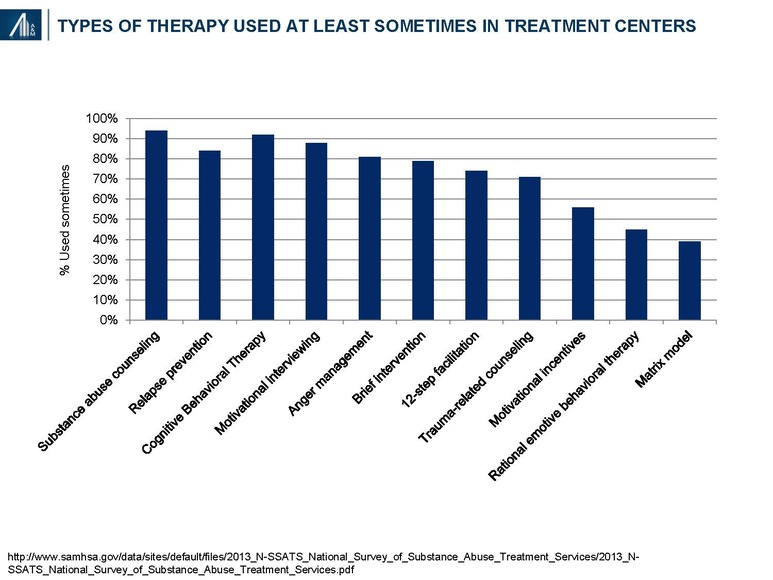
Many different types of therapy, as well as service offerings—transitional, ancillary and other disorders—are used in the treatment of substance abuse and dependency disorders. Nearly all treatment centers offer substance abuse counseling, relapse prevention, cognitive behavioral therapy, motivational interviewing techniques and other behavioral approaches. A description of each form of therapy is provided in the Appendix of the article.
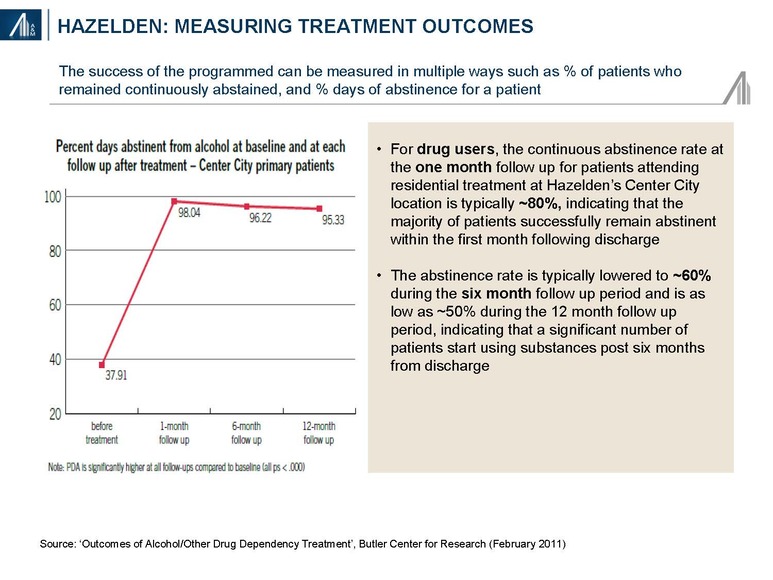
Detailed and standardized evidence-based guidelines for addiction treatment have not been developed due to the variability in patient need; i.e., drugs of abuse, co-morbidities, psychosocial factors, etc. In addition, most treatment centers do not have longer-term longitudinal outcomes data. Data from Hazelden, a nationally recognized nonprofit addiction organization founded in 1949, suggests more favorable outcomes from alcohol abuse (95%) at one year post-discharge relative to illicit drug use (50%). The Hazelden results may not be generalizable to other treatment centers due to patient selection bias and difference in treatment approach.
Treatment center revenue model reflects the “Wild West”
According to CMS, healthcare consumption expenditures, excluding investment in research, structures and equipment totaled $3.1 trillion in 2015. Private health insurance premium payments accounted for 35.3% of the total, followed by Medicare (21.0%), Medicaid (17.7%), out-of-pocket (11.4%) and other government and non-government expenditures (14.6%).39
The substance abuse market is bifurcated into two segments: commercial and out-of-pocket (29%), and Medicaid, the majority of the remainder. The commercial segment is unlike any other in healthcare, with high out-of-pocket expenditures of 30–100% depending upon the arrangement. For plastic surgery, 100% out-of-pocket is considered a discretionary expenditure, whereas SUD is potentially an acute emergency that potentially can lead to accidental death due to overdose.
Common performance metrics such as the “Average Patient Revenue (APR)” and “Average Net Patient Revenue (ANPR)” reflect the aggregation of multiple factors including:
1. Network status. Is the residential treatment center (RTC) in-network or out-of-network? Many privately funded, for-profit RTCs’ are out-of-network. The traditional in-network payment is negotiated by the insurance company and represents a percentage of charges; i.e., allowable. The insurance company then pays 80% of the allowable (after the individual deductible is met), whereas the client pays the remaining 20%.
The out-of-network model is far different. RTC’s essentially charge “whatever” and then assume an allowance for doubtful accounts. The insurance company may pay a percentage of the charge, typically 40–60% but can be less, with the client accountable for the remainder. Essentially, the client is paying an “out-of-network” penalty based on the insurance company payment policy. Families are often desperate and often assume the liability. Out-of-network costs are an economic burden for the vast majority of Americans.
2. Payer mix, service coverage and payment methodology. Among the services provided include detoxification, residential services, partial hospitalization (>20 hours per week in residential setting) and outpatient services. Insurance companies tend to cover detoxification services, assuming medical necessity for <5 days, residential services for 7–28 days and many (but not all) of the services provided as partial hospitalization and outpatient services. Until recently, most insurance companies covered inpatient stays of 28–60 days, excluding room and board charges associated with partial hospitalization and / or outpatient services in a “safe house” (“sober living”), the latter often being the direct (out-of-pocket) payment responsibility of the client. Facilities are often reimbursed on a per diem basis rather than per service.
Per Diem reimbursement varies dramatically by a factor of 2–4x. BCBS is typically at the lower end of per diem reimbursement, with national carriers not exhibiting a consistent trend. Residential reimbursement can vary from $600 to $2,000+ per day, partial hospitalization from $500 to $1,500+ per day and intensive outpatient therapy from $400 to $1,000 per day. Alternatively, reimbursement could be provided for a bundle of assumed services or on a service-by-service basis.
3. Many Blue Cross organizations reimburse members directly for out-of-network services. Blue Cross will often reimburse their members directly for out-of-network services, assuming that the member will apply this payment toward the total charge for which he / she is liable. While this practice has historically occurred for smaller ticket items such as physician visits and the occasional ambulatory surgery visit, longer term SUD treatment can result in bills totaling tens of thousands of dollars. Direct payments to recovering addicts by insurance carriers, inclusive of payments owed to SUD facilities, has the unintended consequence of potentially undermining the intended benefit of treatment; transfer of insurance payments to providers may also not occur.
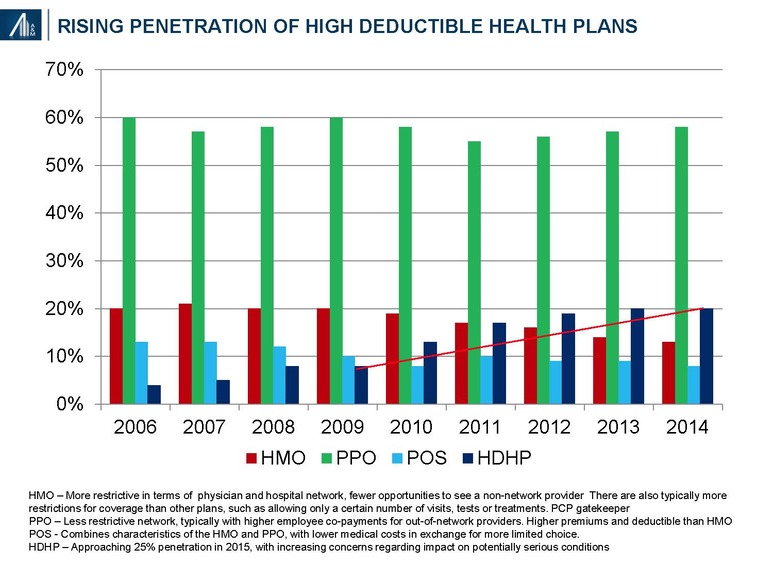
4. Self-pay is disproportionately high relative to other chronic conditions. Clients and / or their families often sign contracts regarding outstanding balances—the latter dependent upon network status and payment methodology. An inverse correlation exists between third-party commercial payments and out-of-pocket payments. The growth of high deductible plans and increased cost-shifting among HMO / PPO plans further raises self-pay costs; penetration reached 24% in 2015.40 Private loans may be offered to the uninsured and individuals with limited coverage. The high rate of recidivism may result in multiple episodes of residential stays within any given year.
5. Continuum of services. Average length of stay (LOS) and average net daily revenue (ANDR) are important performance measures. The average LOS reflects the range of offered services, from detoxification to residential, partial hospitalization and outpatient services whereas the ANDR reflects the mix of payments for services, net of allowances.
6. Admissions. Publicly-traded companies such as Acadia Healthcare (Ticker: ACHC) and American Addiction Centers (Ticker: AAC) have grown via acquisition. Opportunities for leverage of sales and marketing, information technology, revenue cycle (collections) and corporate overhead exist. The overall utilization rate for for-profit designated beds is 96.8%. Performance measures include client admissions and average daily census.
7. Regulatory compliance. Fraud has been reported among a few operators of SUD services. Typical allegations include a failure to collect the full deductible or required co-payments; and the provision of unnecessary services.
Diagnostic testing represents a key component for some, but not all SUD facilities.
Excessive testing of SUD clients has been reported. Specific testing protocols have been developed for screening and confirmatory tests, the frequency of testing and the number of tests in a specific panel. Testing is usually done at the class level (e.g., opiate), and not substrate (i.e., types of opiates such as hydromorphone, oxymorphone, dihydrocodiene, methadone, fentanyl, etc.). The University of Colorado and others have developed test panels capable of identifying over 100 different substrates from a single sample. Samples may be tested in-house, and at in-network and out-of-network labs.

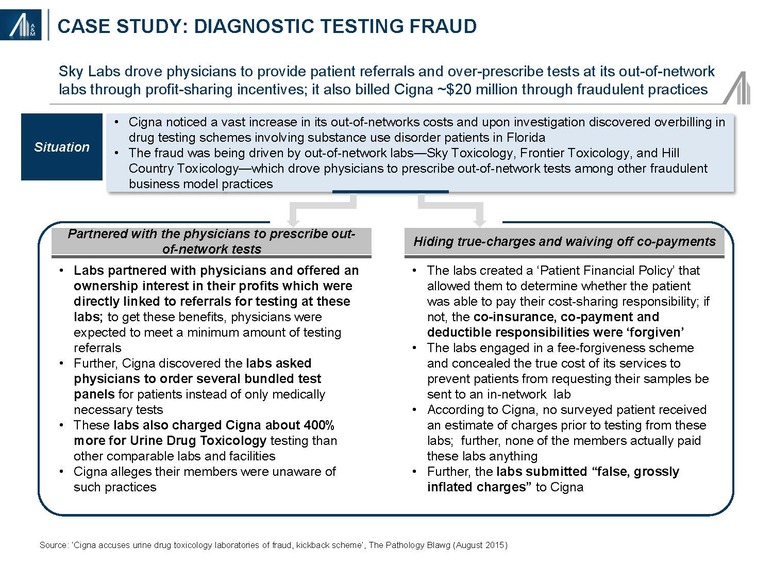
Fraud has been reported in the SUD diagnostic testing segment resulting in increased payer scrutiny and changes in carrier and employer coverage policies. Among the allegation include physician and patient kickbacks, the performance of tests that were not necessary or medically appropriate, upcoding (i.e., billing for a higher-priced treatment than was actually provided) and unbundling (e.g., billing for individual tests comprising a panel menu).
Historically, organizations have benefited from favorable rates on diagnostic testing. Payers are reducing reimbursement on drug screenings through three primary initiatives:
1) Requiring a positive qualitative result before ordering a more comprehensive and costly quantitative panel
2) Reduction in the number of approved tests per year, regardless of service provider
3) Reduction in the allowable rate of individual tests and test panels
Recommendations:
Our recommendations will vary somewhat based on whether an entity is currently utilizing a predominantly out-of-network or out-of-pocket revenue model. We believe the inordinately high operating margins are unlikely to be sustainable in the not-too-distant future due to increasing payer scrutiny and changes in policies, including the formation of narrow networks of treatment centers. Ongoing carrier consolidation is likely to accelerate the policy standardization process, and perhaps with increased market clout, lead to unilaterally imposed payment policies. The diagnostic testing market is already undergoing significant price pressures.
Operators will increasingly need to consider short-term practices within the context of longer-term industry trends; i.e., generate a 3–5 year strategic plan. Opportunities to utilize in-network commercial models, enhance end-to-end revenue cycle management capabilities, invest in infrastructure (coding, compliance and clinical documentation) and add clinically-oriented case management capabilities (to better interface with payers) require consideration.
The need for professional managerial talent familiar with healthcare policies and procedures, combined with other investment requirements, highlight the potential for competitive advantage associated with scale. Robust capabilities and infrastructure in pricing optimization, managed care contracting, regulatory compliance and care transition management (from remote residential to community of origin outpatient) will become increasingly important. The total “price of recovery” includes the cost of ancillary services, inclusive of diagnostics.
Opportunities may also exist for a distinct offering in Medicaid, despite the funding uncertainty associated with healthcare reform, as well as the commercial government employee sector (federal, state and local) — and its requirement for compliance with various OIG provisions. Marketing practices such as those highlighted in the March 19, 2016, BuzzFeedNews article entitled “Addicts for Sale” will no longer be possible.41
Despite the industry risks, opportunities exist to provide a more evidence-based, cost-effective and in-network treatment regimen. The unmet need continues to grow.
About the Authors
David Gruber MD, MBA is a Managing Director and Director of Research with the Alvarez & Marsal (A&M) Healthcare Industry Group in New York, specializing in strategy, business development, commercial due diligence, analytics and health benefits. He has more than thirty-two years of diversified healthcare experience as a corporate executive, Wall Street analyst and consultant.
Steven Boyd, Managing Director is a Managing Director with Alvarez & Marsal’s Healthcare Industry Group with more than fifteen years of financial and operating experience serving private equity owned healthcare companies. Mr. Boyd has deep operating experience in several segments of healthcare including toxicology laboratories, medical devices & diagnostics, physical therapy, dental service organizations, urgent care, and specialty physician practice management organizations.
1https://en.wikipedia.org/wiki/List_of_motor_vehicle_deaths_in_U.S._by_year
2 Coffey S., Volberding P. HIV InSite Knowledge Base. University of California, San Francisco. http://hivinsite.ucsf.edu/InSite?page=kb-01-03.
3 Health, United States, 2015: With Special Feature on Racial and Ethnic Health Disparities. National Center for Health Statistics. Hyattsville, MD. 2016. https://www.cdc.gov/nchs/data/hus/hus15.pdf#019.
4Center for Disease Control and Prevention. Wide-ranging online data for epidemiologic research (WONDER). Atlanta, GA: CDC, National Center for Health Statistics; 2016. https://www.cdc.gov/drugoverdose/data/overdose.html
5Mental Health & Substance Abuse Coverage. US Government Health Care Coverage. https://www.healthcare.gov/coverage/mental-health-substance-abuse-coverage/
6 The Affordable Care Act: Shaping Substance Abuse Treatment. Carnevale Associates LLC. http://www.carnevaleassociates.com/our-work/overview.html/article/2013/04/26/the-affordable-care-act-shaping-substance-abuse-treatment
7 Justification of Estimates for Appropriations Committees. Department of Health and Human Services, Substance Abuse and Mental Health Services Administration. https://www.samhsa.gov/sites/default/files/samhsa-fy-2018-congressional-justification.pdf
8Behavioral Health Trends in the United States: Results from the 2014 National Survey on Drug Use and Health”, SAMSHA http://www.samhsa.gov/data/sites/default/files/NSDUH-FRR1-2014/NSDUH-FRR1-2014.pdf
9 Overdose Death Rates. National Institute on Drug Abuse (NIDA), January 2017. https://www.drugabuse.gov/related-topics/trends-statistics/overdose-death-rates.
10http://hcupnet.ahrq.gov/HCUPnet.jsp?Id=3E79ED34C6EE818B&Form=DispTab&JS=Y&Action=Accept (No working link)
11Nora D. Volkow, M.D. of the National Institute of Drug Abuse, NIH, presentation to the Senate Caucus on International Narcotics Control on May 14, 2014 https://www.drugabuse.gov/about-nida/legislative-activities/testimony-to-congress/2018/americas-addiction-to-opioids-heroin-prescription-drug-abuse
12https://www.drugabuse.gov/about-nida/legislative-activities/testimony-to-congress/2016/americas-addiction-to-opioids-heroin-prescription-drug-abuse (same as above?)
13Heroin epidemic is yielding to a deadlier cousin: Fentanyl; March 26, 2016 http://www.boston.com/news/health/2016/03/26/554498
14Table 3.1 Clients in treatment, by facility operation. National Survey of Substance Abuse Treatment Services, 2013 http://www.samhsa.gov/data/sites/default/files/2013_N-SSATS_National Survey_of_Substance_Abuse_Treatment_Services/2013_N-SSATS_National_Survey_of_Substance_Abuse_Treatment_Services.pdf
15National Survey of Substance Abuse Treatment Services, 2013 http://www.samhsa.gov/data/sites/default/files/2013_N-SSATS_National_Survey_of_Substance_Abuse_Treatment_Services/2013_N-SSATS_National_Survey_of_Substance_Abuse_Treatment_Services.pdf
16Table 1.1a Early Release of Selected Estimates Based on Data from the National Health Interview Survey, January–September 2015 http://www.cdc.gov/nchs/data/nhis/earlyrelease/earlyrelease201602_01.pdf
17Mizrachi, D. Obamacare Throws Lifeline to Young Adults Seeking Health Insurance. Daily Beast, June 7, 2013. http://www.thedailybeast.com/articles/2013/06/07/obamacare-throws-lifeline-to-young-adults-seeking-health-insurance.html;
Families USA: A 50-State Look at Medicaid Expansion, April 2017. http://familiesusa.org/product/50-state-look-medicaid-expansion
18U.S. Department of Labor Fact Sheet: The Mental Health Parity and Addiction Equity Act of 2008; January 29, 2010 http://www.dol.gov/ebsa/newsroom/fsmhpaea.html
19 The White House, Office of the Press Secretary: Fact Sheet. February 02, 2016. https://www.whitehouse.gov/the-press-office/2016/02/02/president-obama-proposes-11-billion-new-funding-address-prescription
20 Nerney, Chris. Expansion of mental health and substance use benefits to provide coverage to millions, Revenue Cycle Insights. March 30, 2016 http://www.revenuecycleinsights.com/news/expansion-mental-health-and-substance-use-benefits-provide-coverage-millions?mkt_tok=3RkMMJWWfF9wsRonuKzJcO%2FhmjTEU5z16OgtWKW1gYkz2EFye%2BLIHETpodcMTcZnM7HYDBceEJhqyQJxPr3MLtINwNlqRhPrCg%3D%3D
21 H.R. 1628, American Health Care Act of 2018. Congressional Budget Office; May 24, 2017. https://www.cbo.gov/publication/52752.
22MACStats: Medicaid and CHIP Data Book – December 2016
https://www.macpac.gov/wp-content/uploads/2016/12/MACStats_DataBook_Dec2016.pdf
23National Drug Intelligence Center (2011). The Economic Impact of Illicit Drug Use on American Society. Washington D.C.: United States Department of Justice. http://www.justice.gov/archive/ndic/pubs44/44731/44731p.pdf.
242013 National Survey of Substance Abuse Treatment Services; and Chan Y, et al. Prevalence and comorbidity of major internalizing and externalizing problems among adolescents and adults presenting to substance abuse treatment. Journal of Substance Abuse Treatment 34(1):14-24, 2008
25Center for Behavioral Health Statistics and Quality. (2015). Behavioral health trends in the United States: Results from the 2014 National Survey on Drug Use and Health (HHS Publication No. SMA 15-4927, NSDUH Series H-50) http://www.samhsa.gov/data/sites/default/files/NSDUH-FRR1-2014/NSDUH-FRR1-2014.pdf
26SAMSHA; Bureau of Labor Statistics http://www.tradingeconomics.com/united-states/labor-force-participation-rate.
27,28,29Principles of Drug Addiction Treatment: A Research-based Guide, National Institute of Drug Abuse, National Institutes of Health, HHS, 3rd Edition, December 2012 https://www.drugabuse.gov/sites/default/files/podat_1.pdf
30 Center for Disease Control and Prevention. Prescribing Data; December 2016. https://www.cdc.gov/drugoverdose/data/prescribing.html
31Prescription Nation 2016: Addressing Americas Drug Epidemic. National Safety Council, 2016.
32Bloomberg School of Public Health. Science Daily, June 2, 2016 https://www.sciencedaily.com/releases/2016/06/160602083239.htm].
33 “Fiscal Year 2018 Budget Information”. National Institute on Drug Abuse. https://www.drugabuse.gov/about-nida/legislative-activities/budget-information/fiscal-year-2018-budget-information-congressional-justification-national-institute-drug-abuse
34Projections of National Expenditures for Mental and Substance Abuse Services, 2010–2020, SAMHSA.
35Table 4.6. Facility capacity and utilization of residential (non-hospital) care, by facility operation: March 29, 2013 http://www.samhsa.gov/data/sites/default/files/2013_N-SSATS_National_Survey_of_Substance_Abuse_Treatment_Services/2013_N-SSATS_National_Survey_of_Substance_Abuse_Treatment_Services.pdf
36Table 4.4 Facility size in terms of number of clients, by facility operations; National Survey of Substance Abuse Treatment Services, 2013 http://www.samhsa.gov/data/sites/default/files/2013_N-SSATS_National_Survey_of_Substance_Abuse_Treatment_Services/2013_N-SSATS_National_Survey_of_Substance_Abuse_Treatment_Services.pdf.
37http://hcupnet.ahrq.gov/HCUPnet.jsp?Id=3E79ED34C6EE818B&Form=DispTab&JS=Y&Action=Accept
38 Gifford, Maria. Private Drug Detox and Withdrawal Programs. http://luxury.rehabs.com/drug-detox/#withdrawal; http://www.webmd.com/mental-health/addiction/alcohol-withdrawal-symptoms-treatments.
39National Health Expenditures, Projected. Table 3 https://www.cms.gov/Research-Statistics-Data-and-Systems/Statistics-Trends-and-Reports/NationalHealthExpendData/NationalHealthAccountsProjected.html
40Islam I. Trouble Ahead for High Deductible Plans. Health Affairs Blog; October 7, 2015 http://healthaffairs.org/blog/2015/10/07/trouble-ahead-for-high-deductible-health-plans/
41Ferguson, Cat. Addicts for Sale. BuzzFeed News, March 19, 2016. http://www.buzzfeed.com/catferguson/addiction-marketplace.