HHS Announcement 'Signals' Acceleration of Payment Reform
On January 26, 2015, U.S. Department of Health and Human Services (HHS) Secretary Sylvia Burwell made the following announcement:
“Today, for the first time, we are setting clear goals — and establishing a clear timeline — for moving from volume to value in Medicare payments. We will use benchmarks and metrics to measure our progress; and hold ourselves accountable for reaching our goals. Our first goal is for 30 percent of all Medicare provider payments to be in alternative payment models that are tied to how well providers care for their patients, instead of how much care they provide — and to do it by 2016. Our goal would then be to get to 50 percent by 2018. Our second goal is for virtually all Medicare fee-for-service payments to be tied to quality and value; at least 85 percent in 2016 and 90 percent in 2018."1
The announcement follows a multi-year effort by Centers for Medicare and Medicaid Services (CMS) at incremental payment reform, as well as pilot testing. In 2014, Medicare accounted for 20.4 percent of national healthcare expenditures ($3,057 billion) and 26.3% of hospital spending ($959.9 billion).2
In this article, we review the convergent impact of ongoing drivers of change — federal and state government, CMS, the Health Information Technology for Economic and Clinical Health (HITECH) Act, managed care, employers and employees — that will coincide with an acceleration of CMS payment reform to impact providers, especially hospitals and health systems.
Accelerated payment reform driven by aging demographics, a forecast rise in expenditures and “crowding out” of healthcare spending by other federal and state obligations
The number of Americans over the age of 65 is forecast to increase from 40.3 million in 2010 to 56.0 million in 2020, as compared to the under 65 year old population increasing from 268.4 million to 277.9 million during the same period. Due to its rapid growth, the over 65 population will represent 16.7 percent of the total in 2020, as compared to 13.0 percent in 2010.3 Per capita healthcare spending is 2.5 to 3.0 times higher in the aged population.
Federal ($859 billion) and state and local governments ($544 billion) account for 46 percent of 2014 national health expenditures, whereas households ($822 billion), private employers ($624 billion) and other private sources ($208 billion) account for the remainder.4
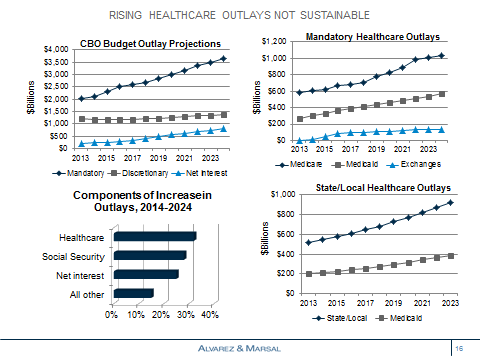
The Congressional Budget Office has forecast an increase in mandatory government outlays driven by healthcare, social security and net interest payments. Mandatory healthcare outlays increase from $1.0 trillion in 2015, or 26.6 percent of the total, to $1.7 trillion in 2024, or 30.0 percent; the compound annual growth rate during this period is 6.4 percent.5 Net interest payments more than triple from $251 billion in 2015 to $799 billion in 2024, thereby “crowding out” investment in healthcare and elsewhere.
The Federal government funds Medicare, 57 percent of Medicaid (excluding PPACA-related enrollees at a sustainable 90 percent) and a wide variety of other programs.6 An increase in the Medicaid income threshold to $33,465 for a family of four, combined with the enrollment of 3.3 million previously eligible beneficiaries, has reduced the number of uninsured by 13.4 million.7 The PPACA does not, however, affect dual eligible — the primary driver of rising Medicaid spending. In 2010, dual eligible beneficiaries accounted for 14 percent of Medicaid enrollees and 36 percent of expenditures.8
States fund 43 percent of Medicaid and in conjunction with local municipalities, the health benefits of their employees (at a total cost more than double that of Medicaid). States with the largest unfunded pension liabilities — California, Illinois, New Jersey, and Ohio — face additional funding constraints.
Accelerated implementation of payment reform follows period of reimbursement evolution and experimentation
CMS Medicare value purchasing initiatives focus on the quality and safety of inpatient care. The funding formulae has evolved from an initial focus in FY2013 on the process (70 percent) and experience of care (30 percent) , to a greater focus on risk-adjusted outcome (re-admissions, mortality) and efficiency (Medicare spending per beneficiary) measures. Note, the FY2013 payment period, beginning October 2012 reflected performance in July 2011 to March 2012.
In FY2015, 724 hospitals fell within the lowest quartile of nosocomial adverse event performance (e.g., infections, pressure ulcers, pulmonary embolism) and were penalized 1 percent of their Medicare payments — the first year of CMS’ effort to reduce the frequency and impact of hospital acquired conditions.9
The number of Pioneer Accountable Care Organizations (ACO), launched in January 2012 for providers experienced with care coordination across multiple settings, has declined from 32 to 19, whereas the number of Medicare Shared Savings Plan participants approximates 400.10 CMS has also been experimenting with alternative forms of payment bundling, with an emphasis in orthopedics (e.g., joint replacement, spinal fusion) and cardiovascular disease (e.g., implants, bypass) in the acute and post-acute care period.
Other major reimbursement initiatives include a Physician Quality Reporting System (PQRS), the post-acute care Impact Act and changes in coverage requirements for specific sectors (e.g., long term acute care hospitals, rehabilitation)
Accelerated payment reform preceded by the HITECH Act
The HITECH Act, a portion of the bill known as the American Recovery and Reinvestment Act (ARRA) of 2009, included $19.2 billion to increase the use of electronic medical records by hospitals and physicians. 11 “Meaningful use” incentive payments focused on enhanced data capture and sharing, clinical processes, decision support and outcomes. Despite CMS intentions, inter-operability (health information exchange) across vendors and settings remains limited, and many physicians remain dis-satisfied with electronic health records given input redundancy and challenges with data retrieval.
Nevertheless, the IT infrastructure in 2015 is far better able to “handle” the requirements of payment reform than that which preceded implementation of the HITECH Act. Ongoing IT-related activities focused on population health management require actionable insights and process change, and not just enhanced reporting and visualization capabilities (i.e., dashboards).
Growth of Medicare Advantage and Medicaid Managed Care also affecting care delivery
Medicare Advantage and Medicaid Managed Care initiatives are also serving as levers to facilitate reform. Medicare Advantage enrollment reached 15.4 million for 2014, exceeding a 30 percent penetration rate.12 The penetration rate for Medicaid Managed Care was 74.2 percent in 2013.13
Increasing employer and employee price sensitivity to affect providers
Nearly 170 million Americans have employer-sponsored health insurance.14 Of these, nearly 80 to 90 million — 60 percent of workers in private sector plans — are in self-insured plans. High deductible plan enrollment (exceeding 30 percent), combined with public exchange utilization (10+ million) and the availability of price transparency tools has increased consumer engagement and price sensitivity.15 Large employers, the majority self-insured and at-risk for employee healthcare costs, could also potentially use their purchasing power, either alone or via health coalitions, to create narrower networks or utilize reference pricing to shift provider utilization.
Consolidation, physician acquisition and Medicaid expansion has led to higher hospital profits, but is not necessarily sustainable “as is” in an era of payment reform and a more retail-oriented market
In 2011-2013, there were 285 announced merger and acquisition deals involving 683 hospitals, an increase of 55 percent of deals as compared to 2008-2010 — when there were 184 deals involving 283 hospitals.16 Hospital consolidation, combined with physician practice acquisitions during this period, contributed to a rise in the aggregate hospital payment-to-cost ratio for private payers from approximately 133 percent to 148 percent.17
Medicaid expansion in 28 states (and counting) has reduced the amount of bad debt generated by the uninsured, thereby increasing near-term profitability. The Medicare DSH payment reduction begins in FY2015, whereas the far more meaningful DSH payment reduction (under 45 percent within three years) begins in FY17.
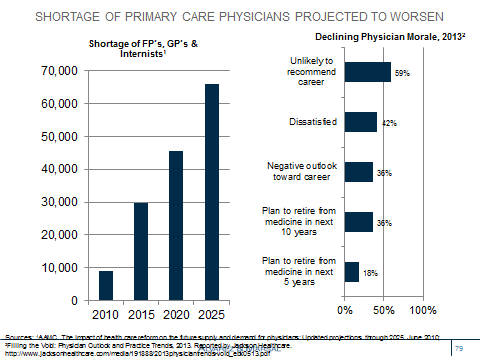
Twenty-six percent of physicians are now employed by hospitals — with an even higher percentage for primary care physicians and cardiologists.18 The projected shortage of primary care physicians is being exacerbated by hospitals focusing on managing patient and referral throughput rather than enhancing efficiency and effectiveness across the continuum of care. Data suggests poor physician morale and lower productivity.
Site-neutral reimbursement, as recommended by MedPAC for evaluation and management visits, outpatient services and ambulatory surgery centers could potentially impact hospital margins. The high cost of hospital outpatient ancillary services to commercial payers, employers and employees — imaging, laboratory, infusion — represents another site of service vulnerability.
Bottom line:
Timing the rate of change is often far more difficult for providers than determining its directionality. Among the factors requiring consideration include the local demand for services; payer mix; supply of services, inclusive of fragmentation and competitive intensity; large, self-insured employer and/or coalition engagement; and local politics.
HHS Secretary Burwell’s announcement highlights the importance of CMS payment reform as a fundamental driver of change and adds clarity to its potential timing. A sense of urgency is now required, as payment reform is expected to catalyze downstream changes.
Next steps for providers should include a population health readiness assessment inclusive of risk-based contracting experience / capabilities, challenges associated with the business model transition from fee-for-service to risk-based contracting, IT infrastructure investment requirements, foundational analytic capabilities (descriptive, causal, predictive) beyond reporting and visualization, chronic care management processes, and efforts to engage patients, their caregivers and surrounding community agencies.
Providers also need to assess their local environs as “winners” and “losers” will inevitably emerge. Efficient and effective providers with risk-management capabilities can potentially introduce health plans or negotiate directly with CMS states and employers, and in the process disintermediate health plans and their 100–150 basis point investment in non-Medical Loss Ratio (MLR) costs.
___________________________________________________________________________
1HHS Press Office. Better, Smarter, Healthier: in historic announcement, HHS sets clear goals and timeline for shifting Medicare reimbursements from volume to value; January 26, 2015
2CMS National Health expenditures
4CMS National Health Expenditures. Table 16, NHE by Type of Sponsor, 2007-23. http://www.cms.gov/Research-Statistics-Data-and-Systems/Statistics-Trends-and-Reports/NationalHealthExpendData/NationalHealthAccountsProjected.html
5CBO. An Update to the Budget and Economic Outlook: 2014-2024; Pub. No. 5005.
6Kaiser State Health Facts. Federal and State Share of Medicaid Spending, FY2012.
7 Ratner S. For Tens of Millions, Obamacare is Working”; NY Times, February 22, 2015
8The Kaiser Commission on Medicaid and the Uninsured. Medicaid’s Role for Dual Eligible Beneficiaries, August 2013.
9McKinney M. Hospital-acquired conditions mean Medicare penalties for 700-plus hospitals. Modern Healthcare, December 18, 2014
10CMS; the American Association of Physical Medicine and Rehabilitation www.aapmr.org/practice/PracticeMgmt/ModelsofCare/Pages/Accountable-Care-Organizations-Listed-by-State.aspx
11http://www.hitechanswers.net/about/about-the-hitech-act-of-2009/.
12AIS Health. MA Plans Grew by 546,495 in February as Penetration Rate Tops 30%; March 12, 2014.
13MCOL. Managed Care fact Sheets>National Managed Care penetration www.mcol.com/managed_care_penetration
14CMS National Health Expenditures, Table 17 Health Insurance Enrollment
15Rattner S. For tens of millions, Obamacare is working. NY Times, February 22, 2015. http://www.businessinsurance.com/article/20131009/NEWS03/131009814;
16Irving Levin Associates, Inc. The Healthcare Acquisition Report, 20th Edition, 2014.
17AHA Trendwatch Chart Book, 2014. Chart 4.6.
18Beckers Hospital Review. Survey: Number of Employed Physicians Up 6%; June 18, 2013.